This is a monthly update on my glycemic management of type 1 diabetes (T1D) using lispro and Basaglar insulin injections, metformin, a ketogenic whole-food diet, and resistance and aerobic exercise (olympic weightlifting and walking).
Interviews and Videos
Interviews and lectures of mine appear on YouTube. My weightlifting videos are also on YouTube.
Introduction
For those who haven’t been following this blog, I was diagnosed with type 1 diabetes (T1D) in September 1998 and followed conventional advice to manage my diabetes for the next 14 years. While my HbA1c was 6.5 to 7% during those years, I suffered from frequent hypoglycemic episodes and grew to loathe them. I stumbled onto the use of a low-carb diet for diabetes in late 2011 and started my ketogenic diet on Feb. 8, 2012. The low-carb ketogenic diet greatly reduced my glycemic excursions and halved my insulin requirements from 58 to 28 IU/day and markedly reduced, but did not eliminate, my symptomatic hypoglycemic episodes. In 2019, in an effort to further reduce my hypoglycemic episodes, I added consistency of meals, exercise, and sleep to my blood glucose management strategy. As a result, I have had only 5 mildly symptomatic hypoglycemic episodes since 2019. In addition, my average blood glucose and standard deviation of blood glucose are equivalent to those without diabetes. This has kept me motivated to continue my regimented lifestyle (relative to most others). Although my lifestyle is regimented and consistent, it does not feel burdensome to me. The decision to make certain lifestyle choices is very individual and I can certainly understand if some might not to want to make all the changes that I have to obtain normal blood sugars. In addition to the avoidance of hypoglycemia, I am motivated to continue my current lifestyle as a result of having witnessed firsthand as a physician for 28 years the consequences of poorly controlled diabetes. It was not just witnessing the hospitalizations, surgeries, procedures, dialysis treatments, and infusions of medications, but most memorably, the suffering my patients with diabetes experienced until they met their death, 11 to 13 years sooner, on average, than those without diabetes. I realize that many with diabetes do not think these consequences will happen to them until they actually do. But if my mentioning these realities of poorly controlled diabetes motivates you to adjust your lifestyle habits to improve your glycemic control, then I will have served a purpose. Hippocrates (460 – 357 BC) said, “Before you heal someone, ask if he is willing to give up on the things that make him sick.” I think that applies to type 1 diabetes. Are you willing to give up refined dietary carbohydrates and sugar and haphazardly timed meals, exercise, and sleep that contribute to rollercoaster blood sugars?
My book, Master Type 1 Diabetes: The Simple, Low-Cost Method to Normalize Blood Sugars, explains in detail the strategies that need to be implemented to achieve normal blood sugars without hypoglycemia and is available in the U.S. on Amazon and internationally on your countries’ Amazon Store in Kindle, Paperback, and Hardcover versions. The book incorporates all the new strategies that I learned since my previous book that have allowed me to achieve truly normal blood sugars. It also describes why blood sugars can be so difficult to regulate with T1D without these strategies. The ‘Look Inside’ feature on Amazon will allow you to read the Table of Contents and some of the book contents. My other book, Conquer Type 2 Diabetes with a Ketogenic Diet, is also available on Amazon in print.
If you feel you might benefit from some individual attention and suggestions for achieving success with blood sugar control for type 1 or type 2 diabetes and/or losing excess body fat, I can assist you with a personal consultation via Skype. See the Coaching page for more info.
My Glycemic Results for March 2024
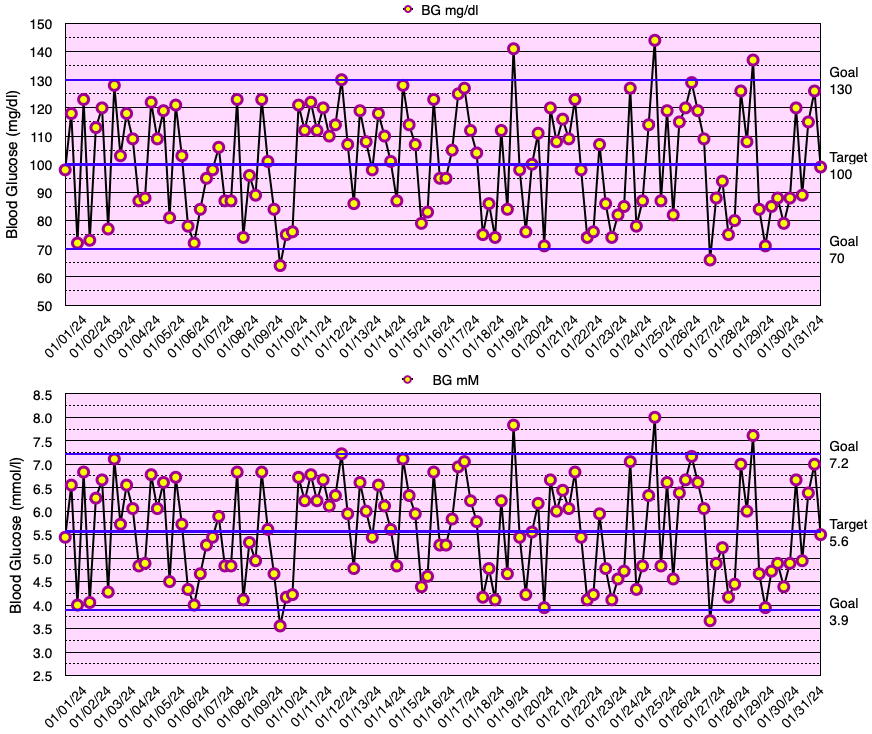
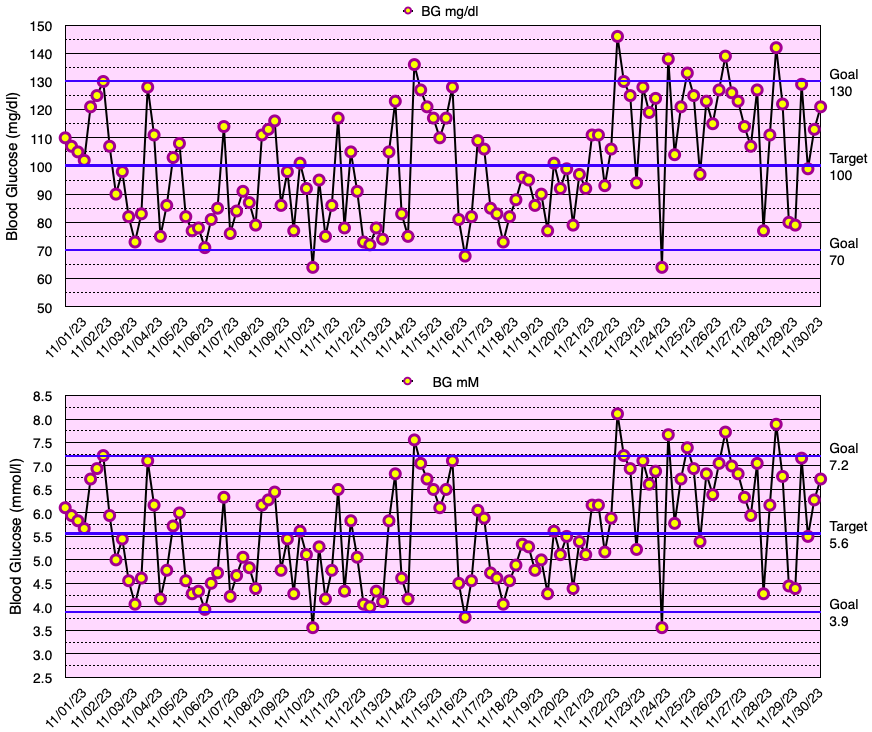
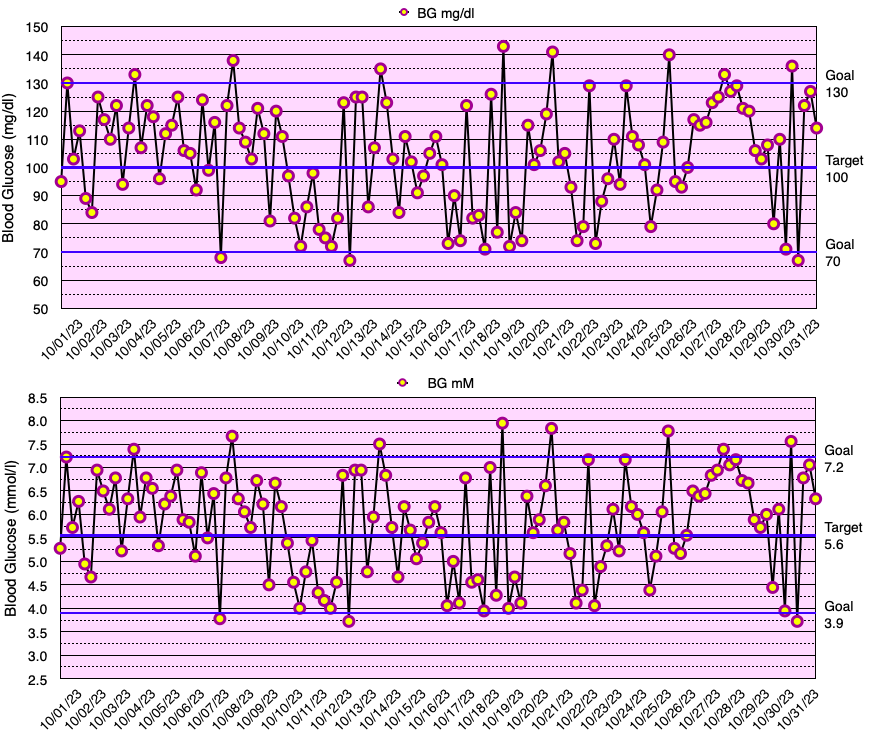
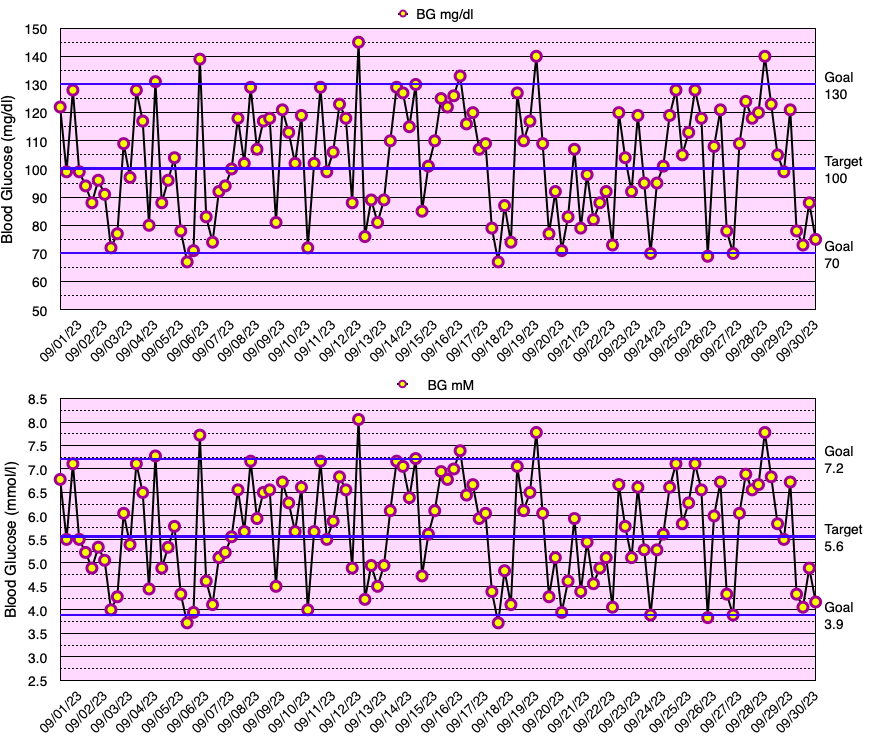
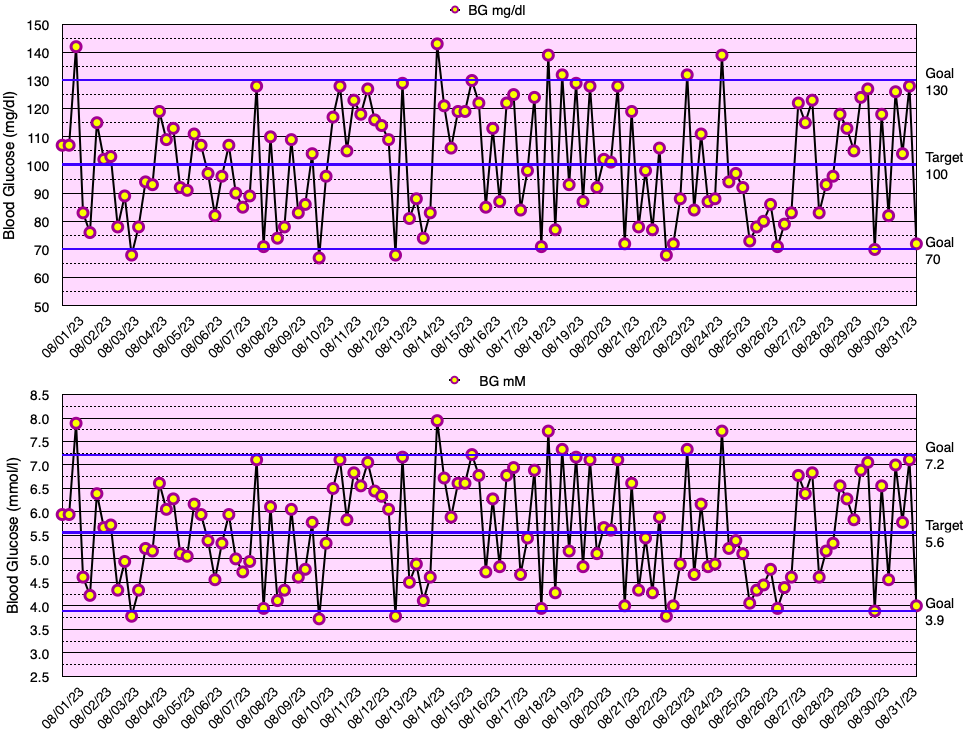
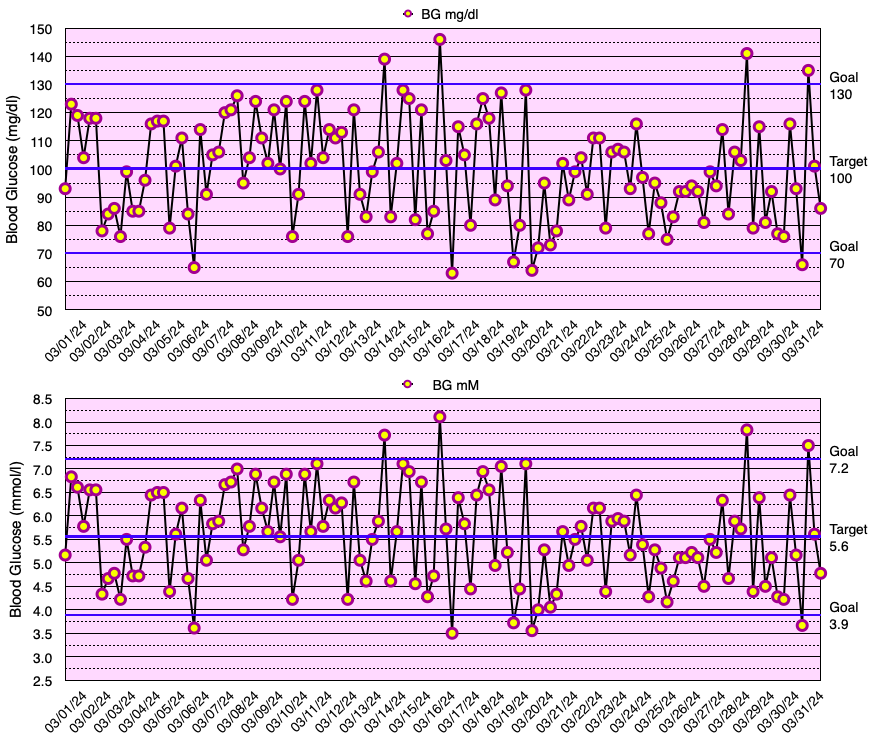
This month, my glycemic results were comparable to those of non-diabetic individuals (see below), but slightly short of my ultimate goal of no blood glucose values < 70 mg/dL. In fact, I have yet to go a month without a few blood glucose values < 70 mg/dL. My average blood glucose for the entire month was 100 mg/dL and the standard deviation of blood glucose (SDBG) was 18 mg/dL. The graph below shows all of my blood glucose measurements for the month in both mg/dl and mmol/l (mM) units of measure.
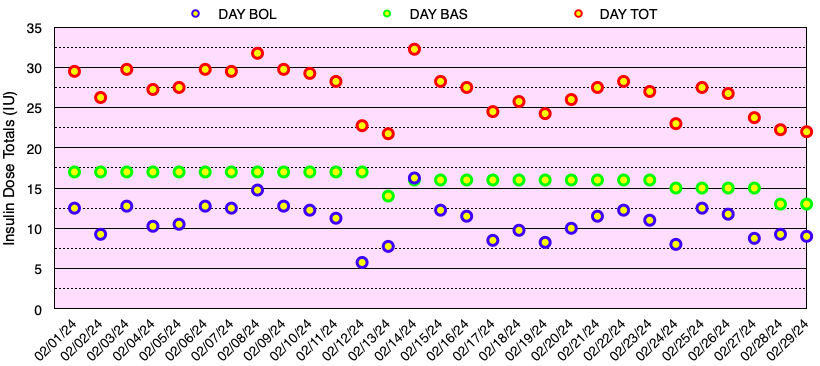
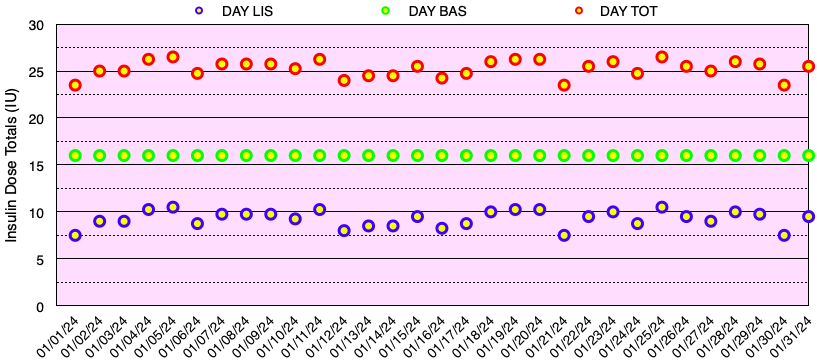
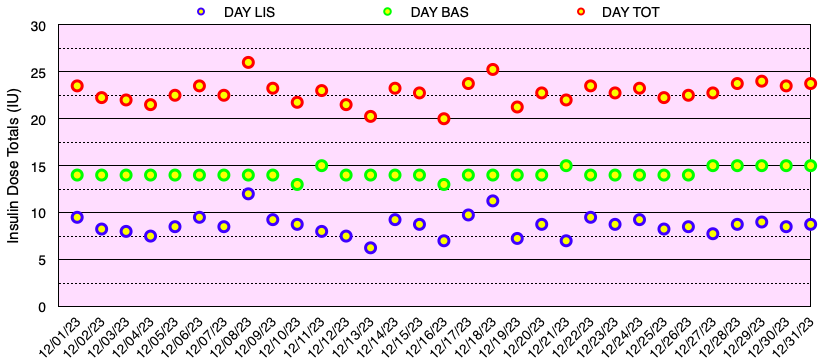
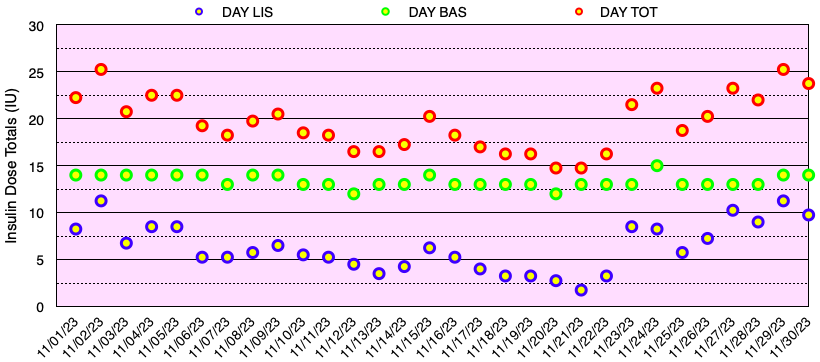
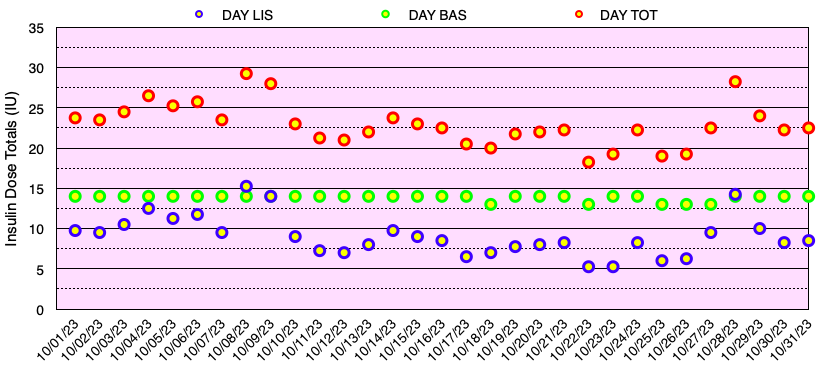
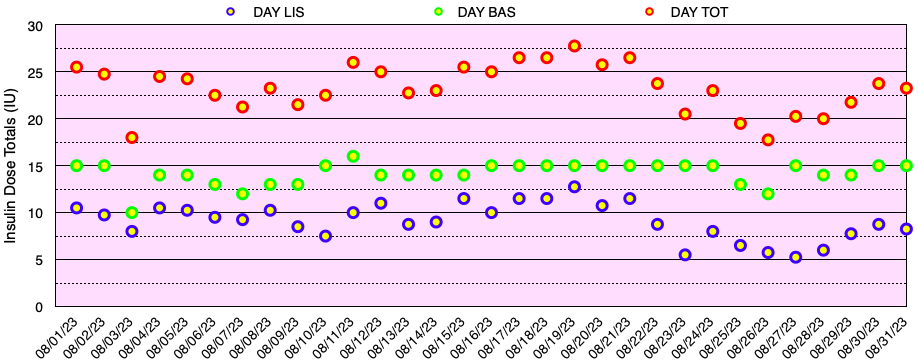
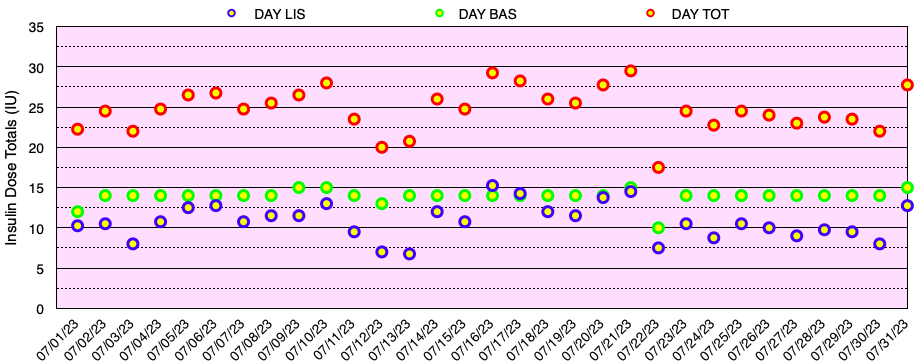
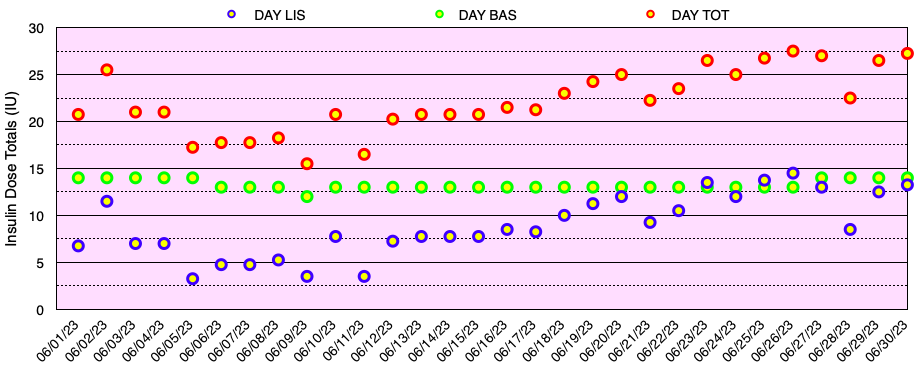
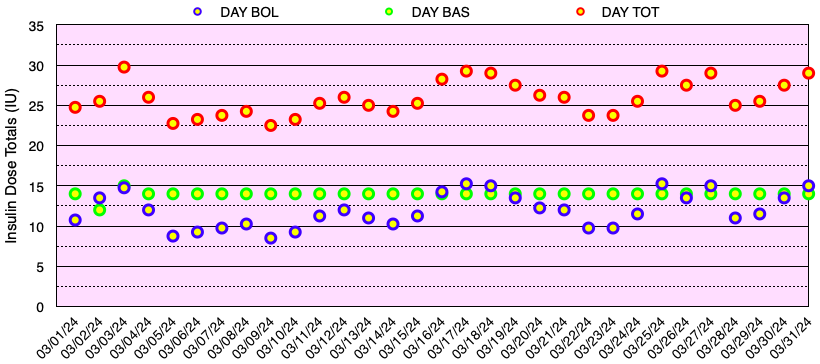
The graph below shows all of the daily insulin dose totals for bolus (lispro) in blue, basal (Basaglar – glargine) in green, and the total daily insulin dose in red. I did not experience hypoglycemia nor need to take glucose for a low blood sugar this month. Note: When needed, instead of glucose tablets or liquid, I use Smarties™ candy which contains 6 grams of dextrose (glucose) per roll.
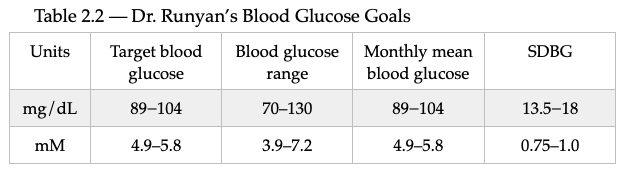
My blood sugar goals are shown in Table 2.2 below. My target blood glucose (TBG) is 100 mg/dl. I have not found any compelling evidence that a TBG < 89 mg/dL has any benefits in terms of reducing the risk of diabetic complications or improving healthspan or lifespan, but the risk of having hypoglycemia definitely increases as the TBG is reduced.
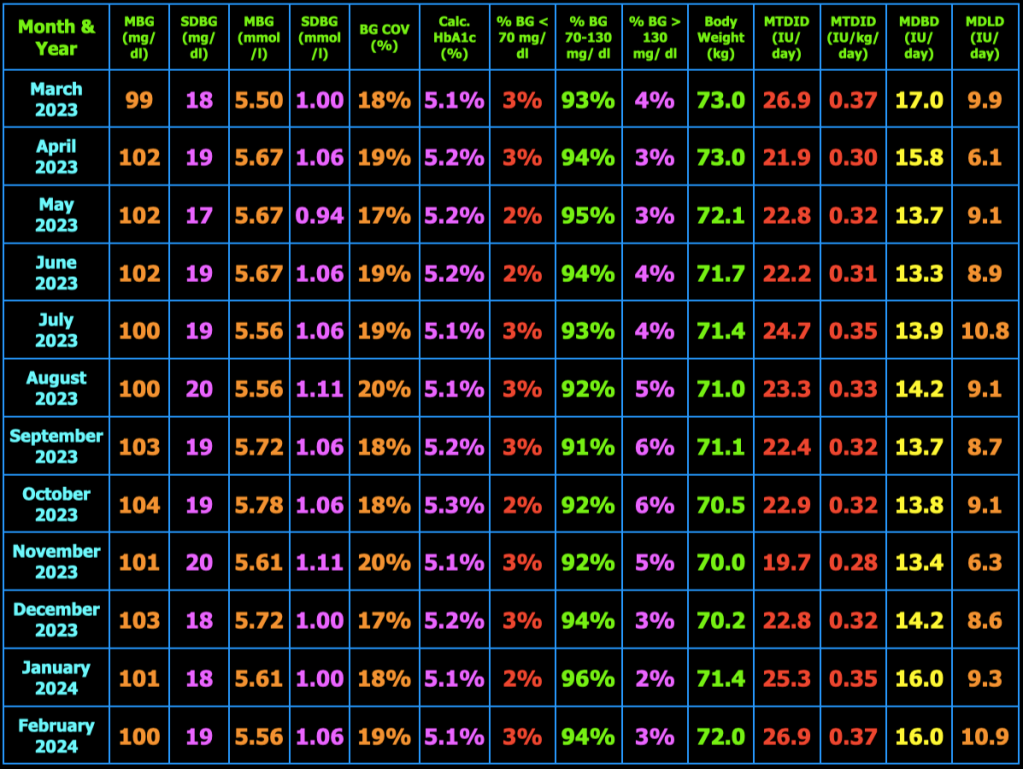
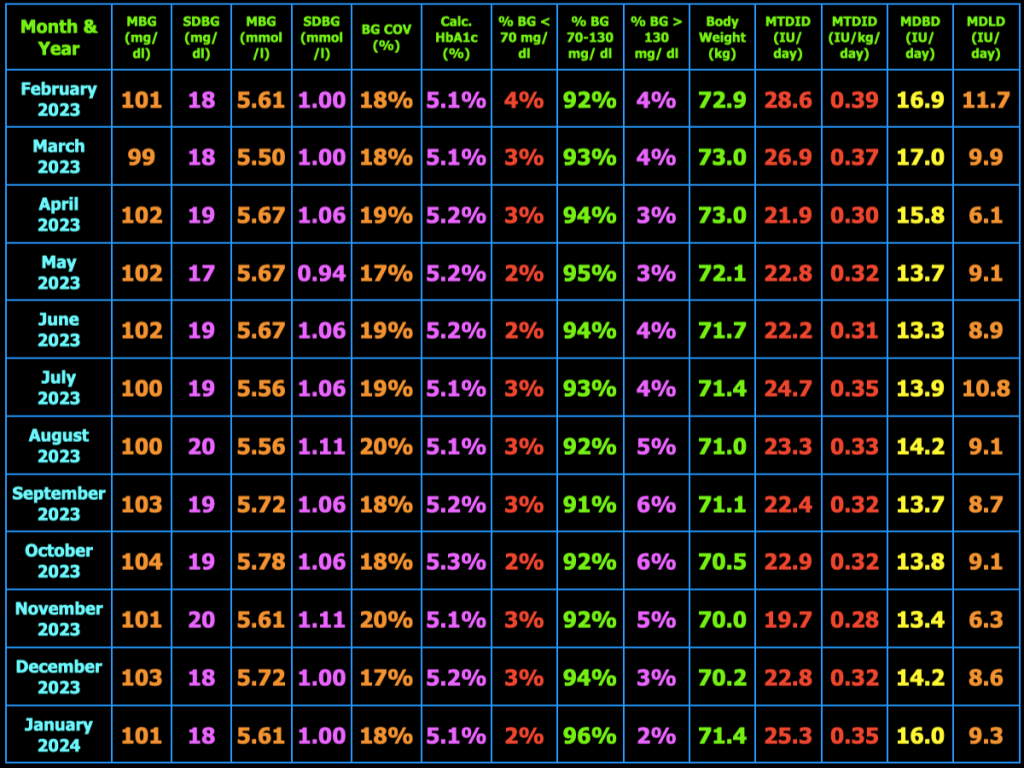
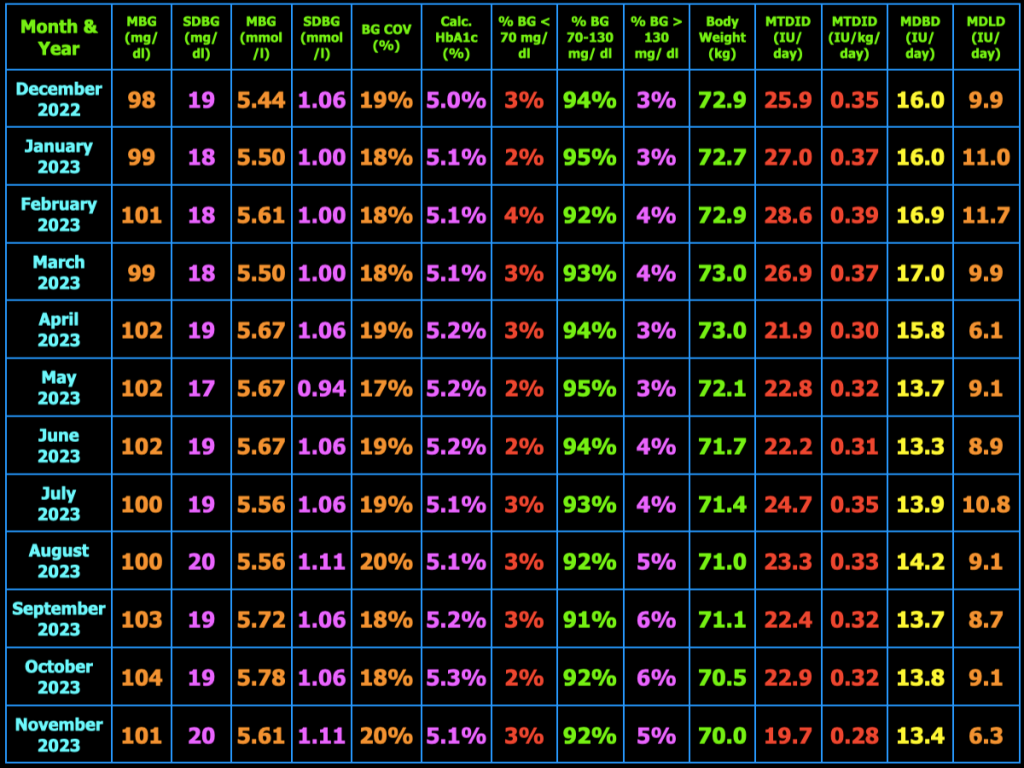
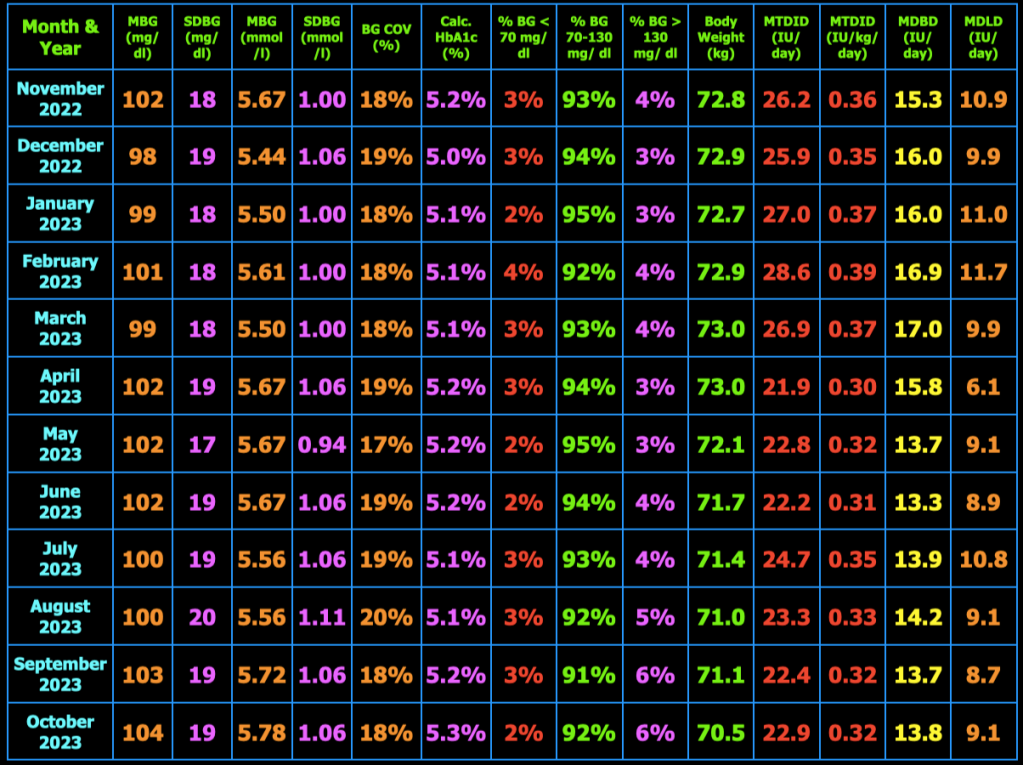
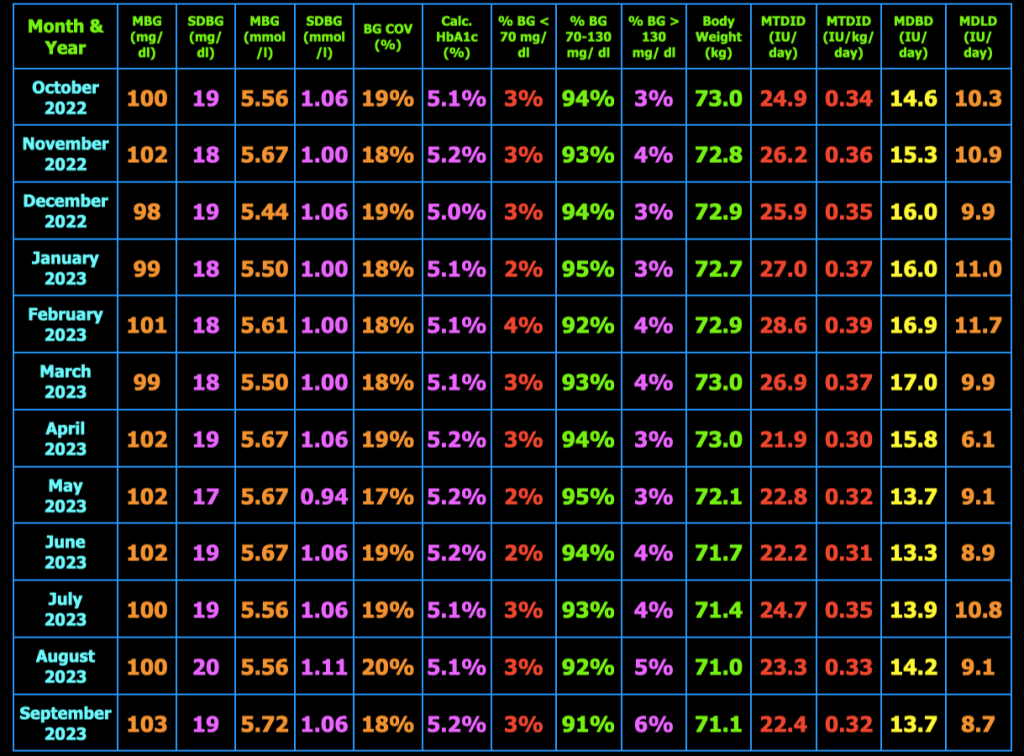
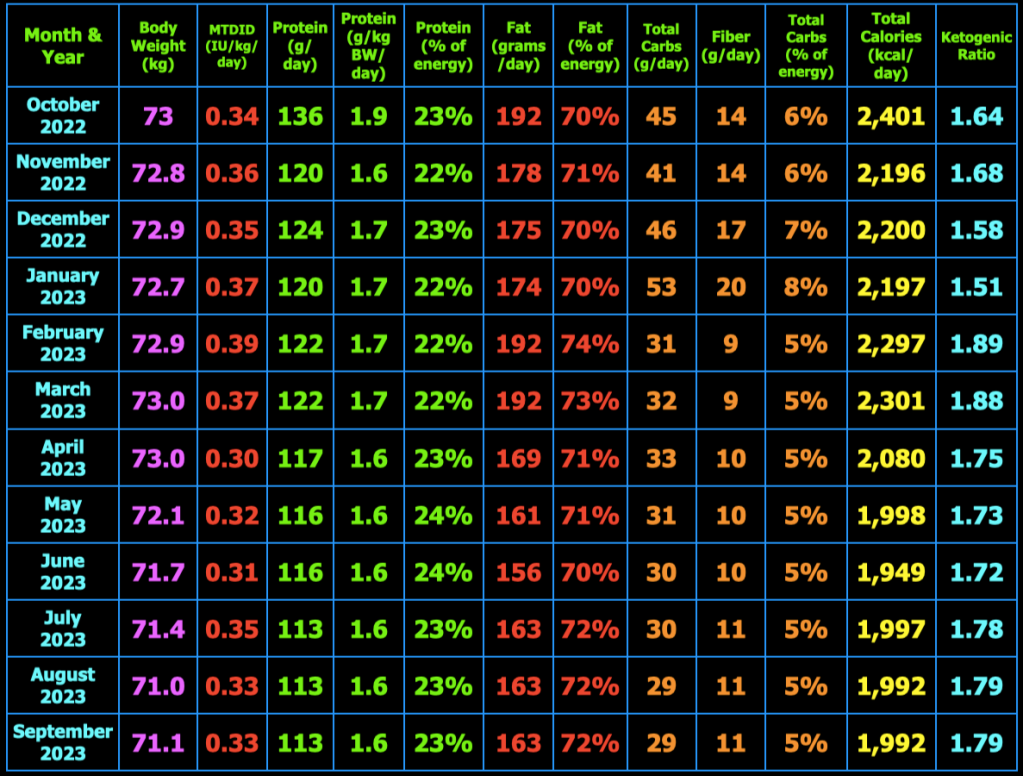
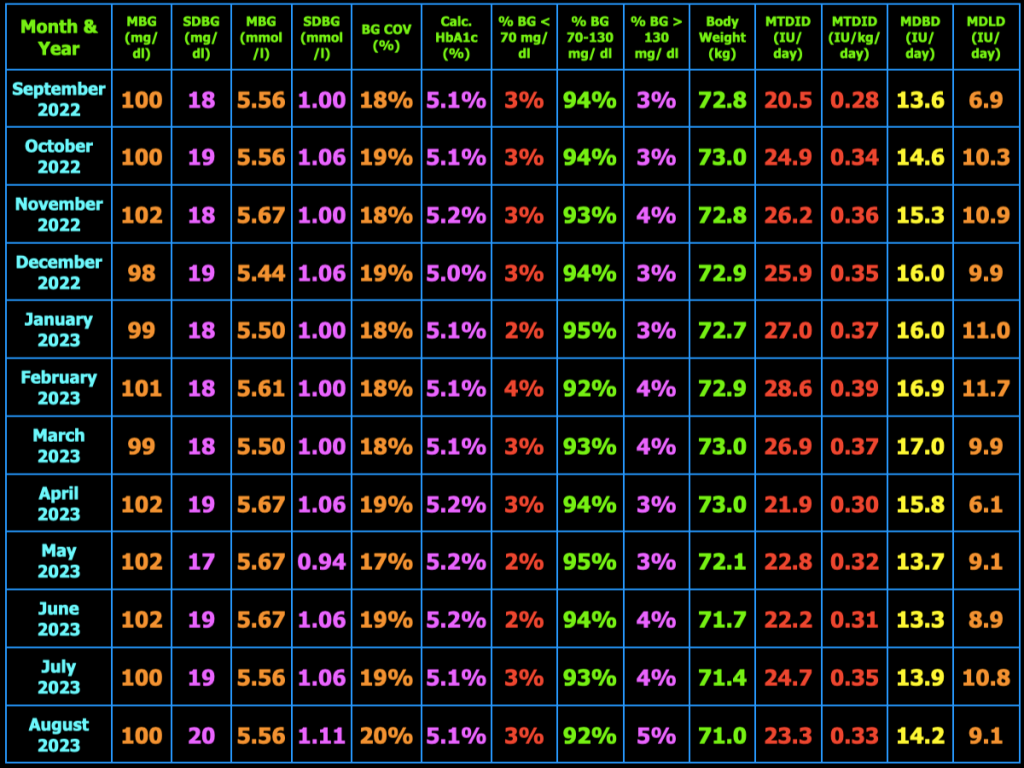
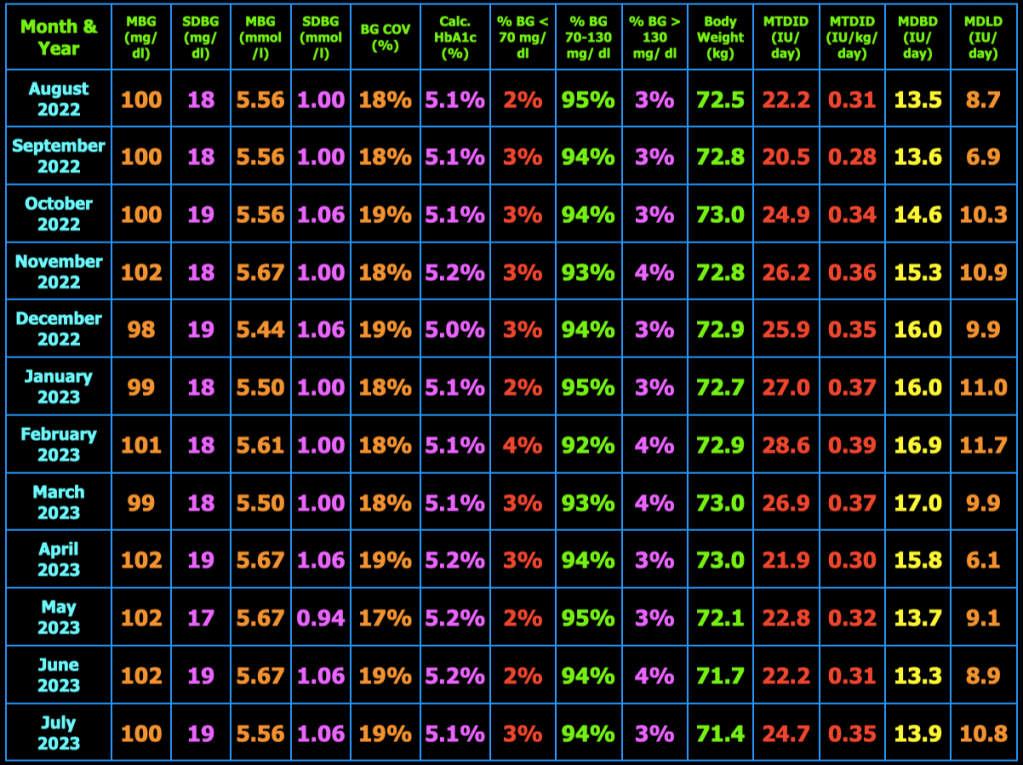
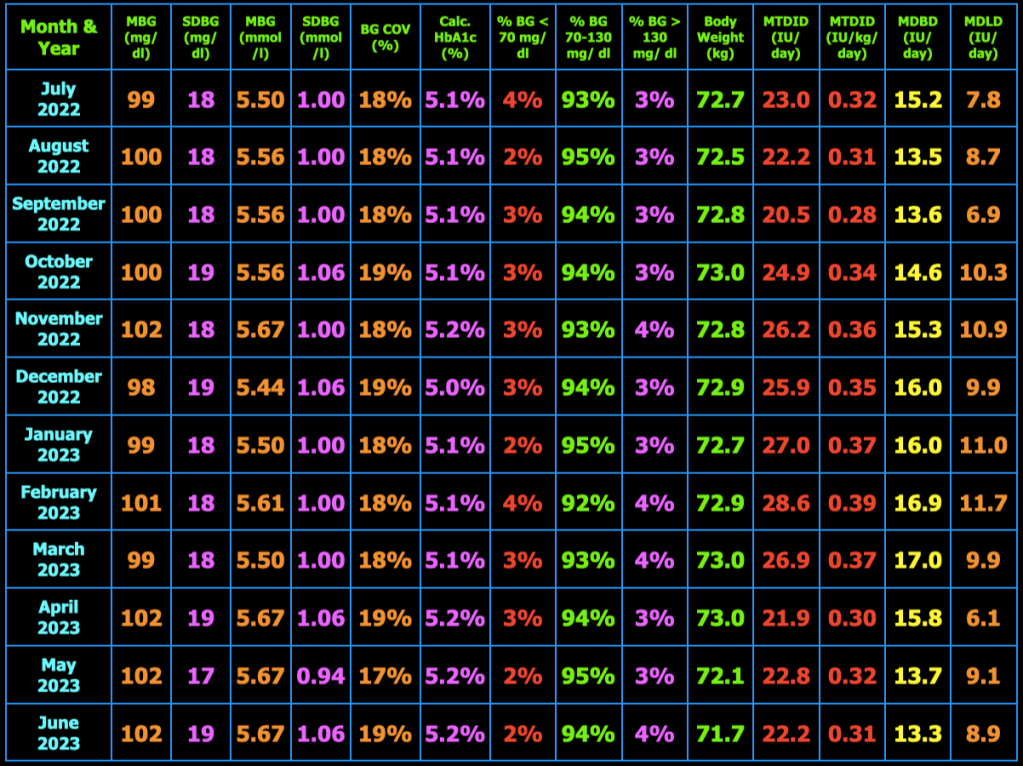
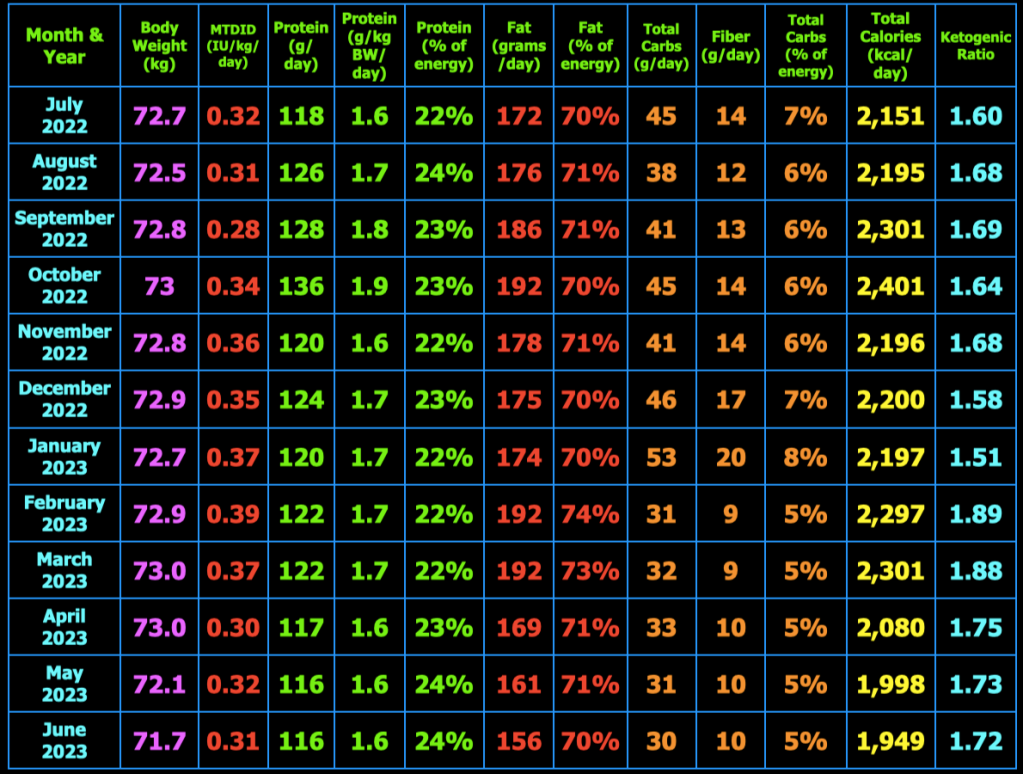
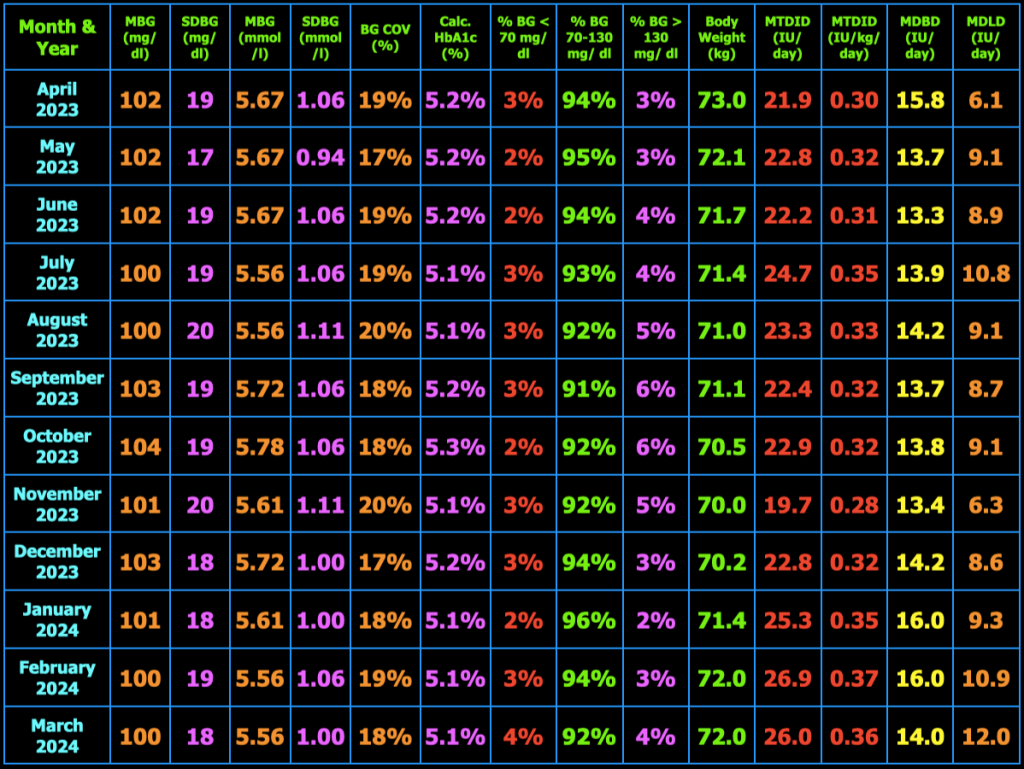
The table below summarizes my glycemic results over the previous year. In the table, MBG = mean blood glucose, SDBG = standard deviation of blood glucose in both mg/dl and mmol/l (mM), BG COV = blood glucose coefficient of variation which equals SDBG ÷ MBG, MTDID = mean total daily insulin dose, MDBD = mean daily Basaglar dose, MDLD = mean daily lispro dose, HbA1c (%) is calculated using the formula, HbA1c (%) = (46.7 + mean BG mg/dl) ÷ 28.7. Additional columns include the percentage of blood glucose values < 70 mg/dL, between 70 and 130 mg/dL, and > 130 mg/dL, and body weight (kg). My goal is to have 100% of my blood glucose values in the range 70−130 mg/dL, but did not quite meet that goal this month.
My Ketogenic Meal Plan
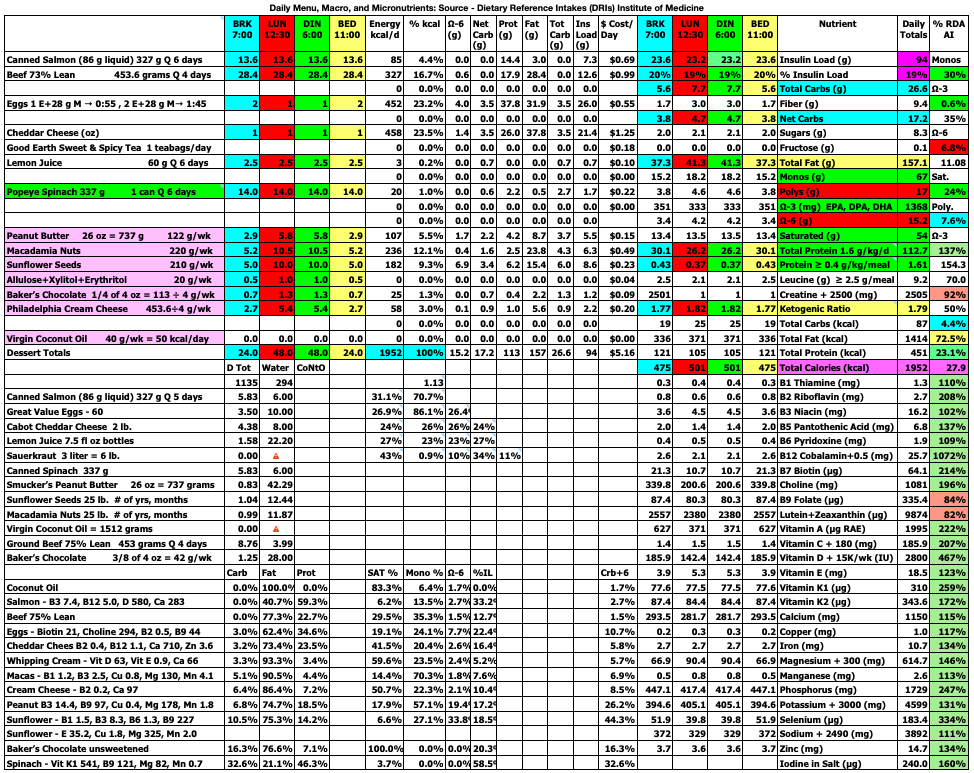
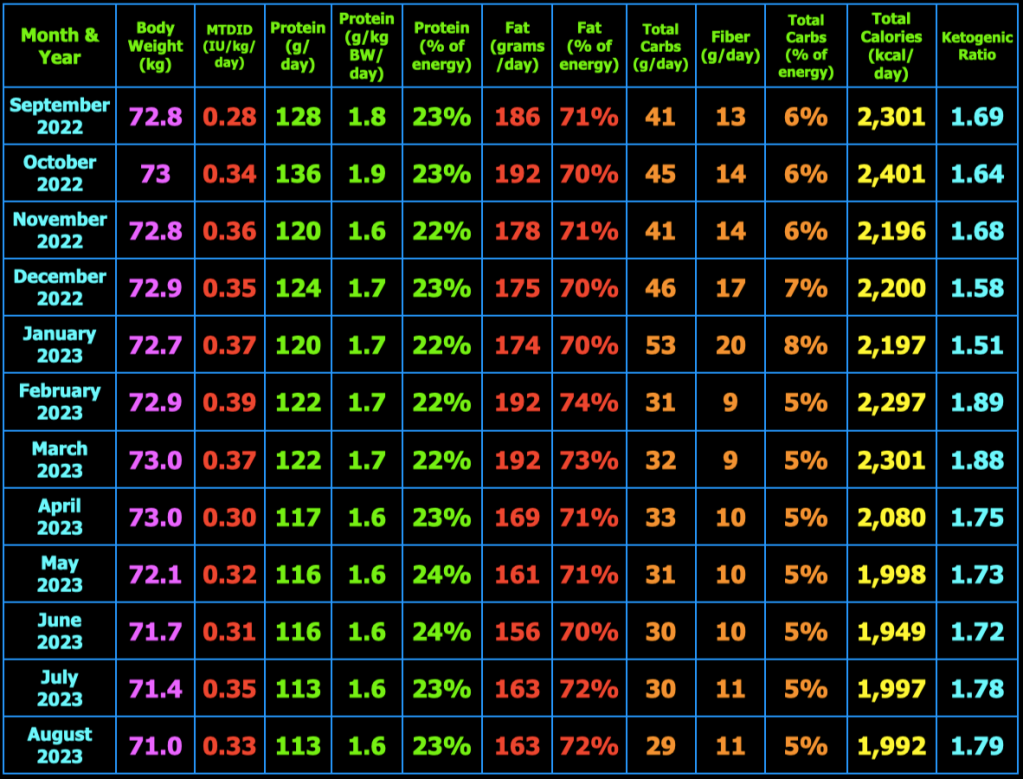
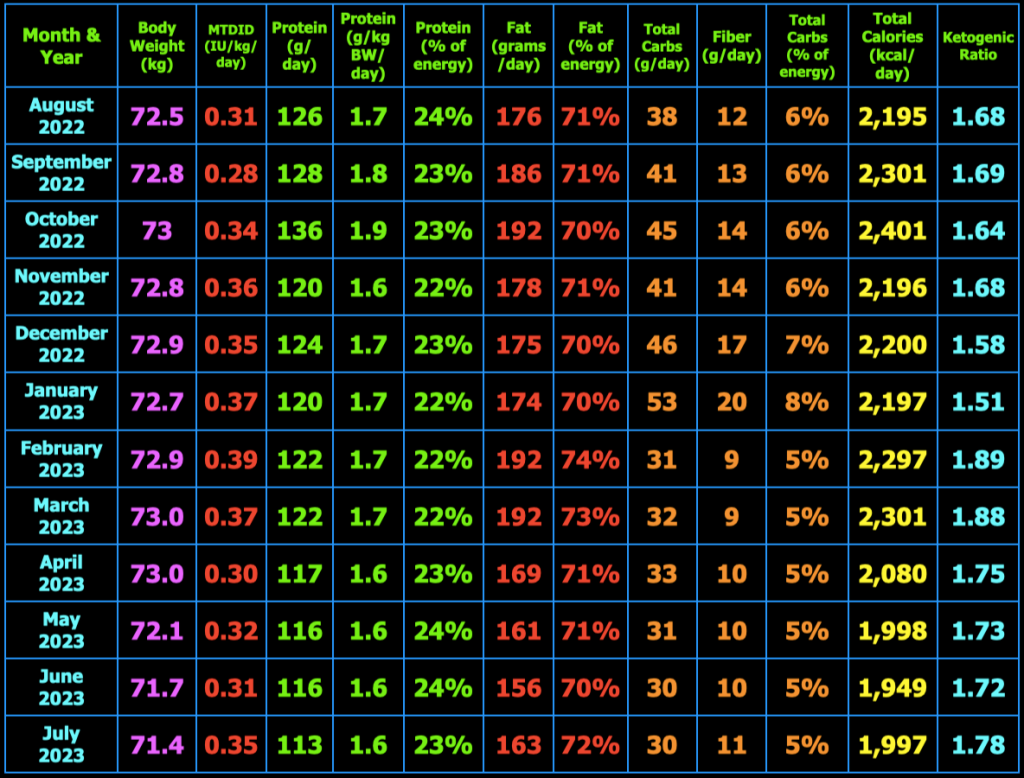
The spreadsheet below is what I use to track my total daily meal macronutrients and micronutrients. Last month, I decreased my macros and calories this month and went back to 3 meals/day. I had determined that the smaller meals when eating 4 meals/day initiated hunger after the meal that was not present before the meal. This month, I decided to increase the total calories and return to 4 meals/day. I also increased my daily protein intake to help with satiety. So far, I am not having hunger after meals.
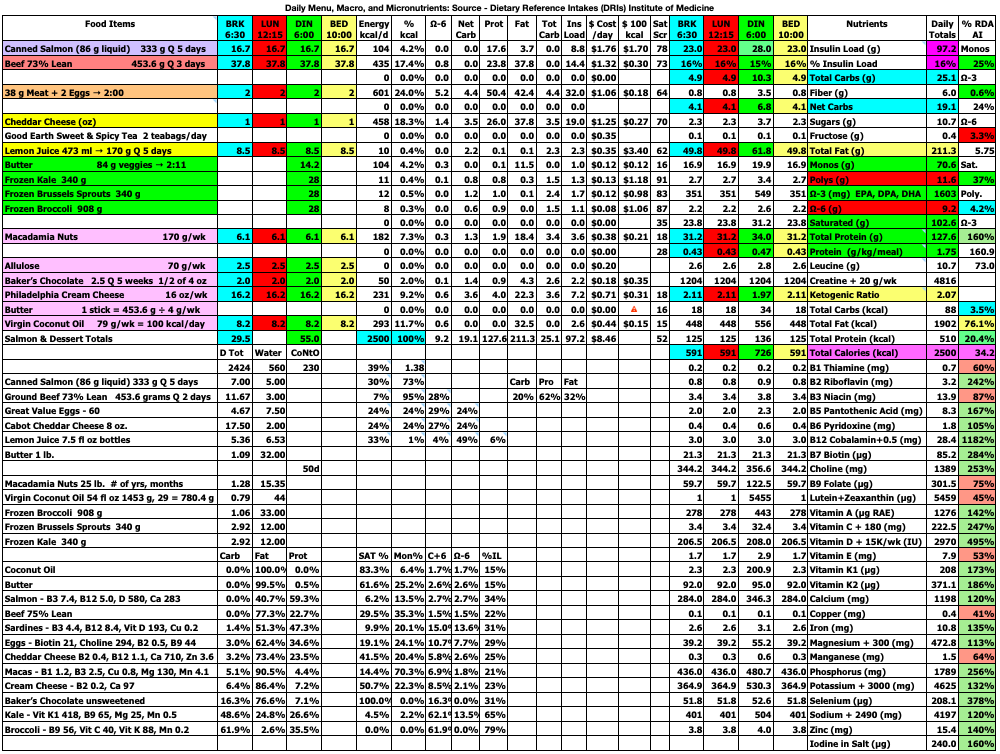
At the top right of the spreadsheet below, you will see Insulin Load (g). Insulin Load (g) is an approximate measure of the relative insulin requirements of a particular meal or diet compared to another meal or diet with different macronutrient amounts. The equation is: Insulin Load (g) = Net Carbs (g) + Protein (g) × 0.4812 + Fat (g) × 0.0788. In words, this means carbohydrates have the largest impact on insulin requirements, whereas protein requires only 48% as much insulin as carbs and fat requires only 8% as much insulin as carbs. These percentages were derived by calculating the area under the insulin curve from this study: Acyl and Total Ghrelin Are Suppressed Strongly by Ingested Proteins, Weakly by Lipids, and Biphasically by Carbohydrates, Karen E. Foster-Schubert, et al., J Clin Endocrinol Metab 93: 1971–1979, 2008. In the study of 16 healthy human subjects, the authors fed the subjects drinks containing either 80% carbs, 10% protein, 10% fat or 80% protein, 10% carbs, 10% fat, or 80% fat, 10% protein, 10% carbs. They then measured blood glucose, insulin, triglycerides, leptin, acyl and total ghrelin concentrations in the blood repeatedly over the next 6 hours. I used the graph in Fig. 2B, to calculate the area under the insulin curves for each of the three drinks to then calculate the amount of insulin in the blood in response to carbohydrate, protein, and fat individually over the 6 hour period. The resulting equation above can be used to estimate the relative amount of insulin needed for one meal or diet compared to another meal or diet. Note that I chose to use net carbs rather than total carbs in my formula because the ingredients of the drinks in the study above did not appear to contain any fiber (see Table 1 in the study) where net carbs (g) = total carbs (g) – fiber (g), and because dietary fiber does not stimulate insulin secretion as far as I know. For example, if diet A contains 50 grams net carbs, 120 grams protein, and 150 grams fat which has 2,030 kcal, the Insulin Load will be 50 g + 120 g × 0.4812 + 150 g × 0.0788 = 120 g. If diet B contains 20 grams net carbs, 120 grams protein, and 163 grams fat which has 2,027 kcal, the Insulin Load will be 20 g + 120 g × 0.4812 + 163 g × 0.0788 = 91 g. Thus, diet B will likely require less bolus and/or total daily insulin than diet A as a result of replacing a portion of the dietary net carbs with dietary fat.
Blood Ketones
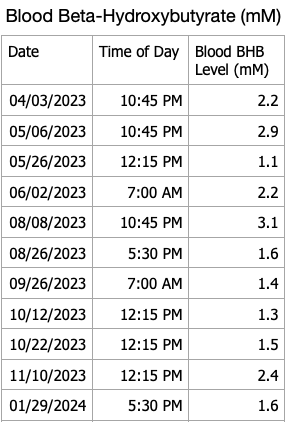
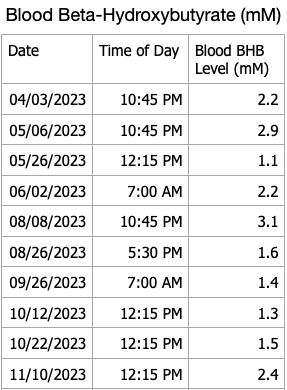
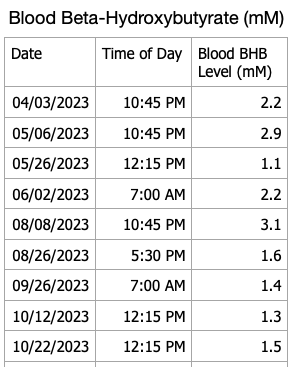
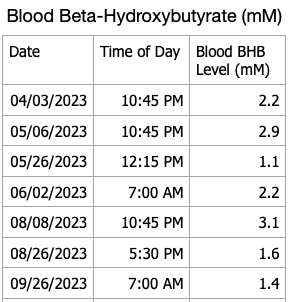
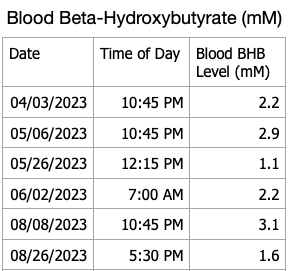
I have blood ketone strips that will eventually expire so I decided to do periodic checks of my blood beta-hydroxybutyrate levels. My recent results are shown in the table below. I forgot to measure ketones this month, will do so in March. My blood ketones continue to remain in the normal range of nutritional ketosis.

For persons with T1D following a ketogenic diet, checking blood, urine or breath ketones can help inform one if they are in fact restricting dietary carbohydrates sufficiently and not consuming dietary carbohydrates or protein to excess. Checking blood ketones can also establish a baseline blood ketone level that can be compared to blood ketones during an illness to alleviate the fear of developing diabetic ketoacidosis if the blood ketone level is close to baseline. Alternatively, if blood ketones are well above baseline ketone levels along with elevated blood glucose, one can increase insulin doses appropriately to lower blood glucose and ketones in consultation with their physician to avoid developing diabetic ketoacidosis.
Exercise
During February, I walked 3 miles in the morning and continued with olympic weightlifting using light weights until I no longer feel discomfort in my right lateral thigh muscle/fascia. In addition to olympic weightlifting, I am doing front squats and deadlifts daily with light weights. Below is a photo of myself from April 2022 at 72.8 kg (160.5 lb.).

What are average blood sugars in persons without diabetes?
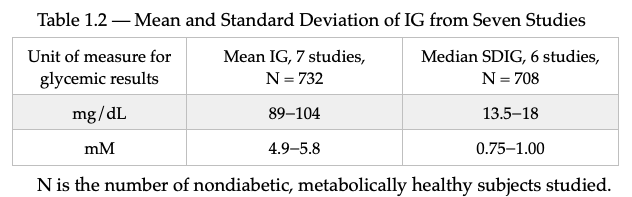
Table 1.2 below shows the mean interstitial glucose (IG) of 732 non-diabetic subjects and standard deviation of the interstitial glucose (SDIG) of 708 non-diabetic subjects as measured by CGM from the seven studies referenced below. One of the studies, Sundberg, F, et al., 2018, was in 15 healthy, normal weight children, age 2−8. The mean CGM 24-hr IG was 95 mg/dL (5.3 mM) and SDIG was 18 mg/dL (1.0 mM). This study again confirms that children’s blood sugars are about the same as those of adults. The age of subjects in these seven studies ranges from 2−80 years. I think it is important for those with T1D to know the glucose results of metabolically healthy study subjects to be used as a reference for seeking normal blood sugars. Although achieving normal blood sugars with T1D is not an easy task, it can be made more difficult by choosing a target blood glucose that is too low and results in hypoglycemic episodes. The lower the target blood glucose, the more likely hypoglycemic episodes are to occur in those with T1D taking exogenous insulin. Having hypoglycemic episodes means that your target blood glucose is set too low. Achieving a normal mean blood glucose without hypoglycemia, requires that one’s glycemic variability as measured by the standard deviation of blood glucose is normal as well.
The references for these seven studies are shown below.
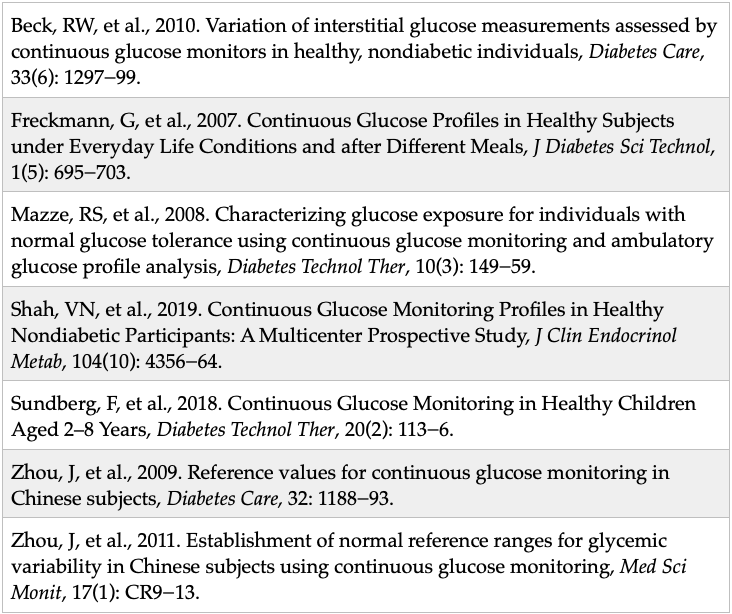
I’ll mention that the authors of Zhou, J, et al., 2011 above concluded that a SDBG <25 mg/dl should be considered to be normal because that was the 95th percentile of the metabolically healthy subjects in their study. The median SDBG in the study was 18 mg/dl which is what I am hoping to achieve each month. My goal moving forward is to eliminate all BG values < 70 mg/dL as part of managing T1D as safely as possible. Although I have yet to achieve this goal for an entire month, I am not discouraged and continue to strive for better results each day.
A new method to calculate the correction factor for use in calculating mealtime insulin doses
Although most of the following is covered in detail in Chapter 5 of my book, Master Type 1 Diabetes: The Simple, Low-Cost Method to Normalize Blood Sugars, I have developed a new method to calculate the correction factor (CF) which is used to adjust the mealtime insulin dose based on the pre-meal blood glucose (pre-BG). Just to review what I explained in my book, I calculate the mealtime bolus insulin dose using the formula, BIDE = MI + CI, where BIDE is the bolus insulin dose estimate, MI is the meal insulin, and CI is the correction insulin used to lower a high preBG or raise a low preBG toward one’s target blood glucose (TBG). The formula for CI = (preBG − TBG) ÷ CF, where TBG is your chosen target blood glucose (mine is 95-100 mg/dl) and CF is the correction factor. In my book, I give guidance and a formula used to estimate your CF based on your total daily insulin dose. However, I have experimented with different ways to determine my CF based on my actual BG and insulin dose data. I have determined that the CF can be estimated by plotting insulin/hour (INS/hr) on the y-axis and change in BG/hr (ΔBG/hr = (postBG – preBG)/time in hours) on the x-axis and computing the slope of the line through the data (by eye) as shown below for the breakfast meal. The graph includes 270 data points from Jan. 2, 2023 through September 28, 2023. Fewer data points would work as well, but I had the data, so I used it.

I then simply select two points on the black line that I drew through the data using Keynote for Mac (or powerpoint for Windows). I chose two (x/y) data points, -25/2.0 and 25/0.75, on the black line and calculate the negative reciprocal of the slope of these two points. In this case, the slope is -0.025 and the negative reciprocal of the slope is 40 mg/dl/IU, where slope (b) = (y₂ – y₁)/(x₂ – x₁). I do the same calculation for lunch, dinner, and bedtime. In essence, if my preBG at breakfast is 140 mg/dl and I, of course, want to lower it to 100 mg/dl, then I will give an extra 1 IU of bolus insulin: Correction Insulin (CI) = (140 mg/dl – 100 mg/dl) ÷ 40 mg/dl/IU = 1 IU. If the preBG at breakfast is 80 mg/dl, then I want to raise it to 100 mg/dl, so I will give less insulin as follows: CI = (80 mg/dl – 100 mg/dl) ÷ 40 mg/dl/IU = -0.5 IU. I had been using 36 mg/dl/IU as my breakfast CF for a long time, so it is interesting to see that this method yields such a similar value. My lunch CF calculated to 50 mg/dl/IU, dinner CF calculated to 48 mg/dl/IU, and bedtime CF calculated to 53 mg/dl/IU. The CF values I am currently using are: breakfast CF = 44 mg/dl/IU, lunch CF = 48 mg/dl/IU, dinner CF = 52 mg/dl/IU, and bedtime CF = 52 mg/dl/IU. Although this method is not necessary to be successful with type 1 diabetes glucose management, I thought some might be interested to know how one can use their actual blood glucose and insulin dose data to calculate one’s correction factors (CF). Finally, the y-intercept can be used as the meal insulin (MI) which is used to calculate the bolus insulin dose estimate (BIDE). The formula is BIDE = Meal Insulin (MI) + Correction Insulin (CI), where CI = (PreBG – TBG) ÷ CF of BIDE = MI + (PreBG – TBG) ÷ CF. Using the graph method, BIDE = y-intercept × time between meals + (PreBG – TBG) ÷ CF. I use the previous 30 days of data to calculate the MI and CF since insulin dose averages vary over time assuming that my dietary intake and exercise regimen that not changed significantly during that time period. If one’s insulin sensitivity is not very stable, then either a shorter time frame than 30 days can be used or a different method altogether could be used to provide a more accurate BIDE.
Closing Thoughts
The purpose of this blog is to share my experience with a low-carb ketogenic diet and exercise to better manage my blood glucose as a person with T1D. A low-carb ketogenic diet also allows for lower daily insulin doses and normal body composition which I believe reduces the risk of developing insulin resistance (double diabetes) and the host of chronic diseases associated with insulin resistance including atherosclerosis, cancer, and neurodegenerative diseases. I also take metformin 500 mg with each of 4 meals daily (2,000 mg/day) to suppress liver glucose production which tends to be chronically elevated in those with T1D. This occurs because we have to inject our insulin in the subcutaneous fat rather than it being secreted by the beta-cells. This results in a lower concentration of insulin around the pancreatic alpha-cells increasing the concentration of glucagon reaching the liver as well as a lower concentration of insulin entering the liver. This, in turn, results in an increase in liver gluconeogenesis and glycogenolysis i.e. liver glucose production relative to those without T1D. In addition to reducing liver glucose production, metformin also improves glucose uptake by skeletal muscle. Metformin, exercise, and a low-carbohydrate diet also improves glycemic control for those with glucose intolerance, prediabetes, type 2 diabetes, and double diabetes [T1D with insulin resistance]. As explained in detail in my book, Master Type 1 Diabetes: The Simple, Low-Cost Method to Normalize Blood Sugars, injecting insulin in the subcutaneous fat is just not the same as when it is secreted by the beta-cells in the pancreas according to the prevailing blood glucose concentration. I have accepted the fact that there will always be more variation in my blood glucose than I would like, but if I can continue to keep the mean and standard deviation of my blood glucose readings equivalent to that of non-diabetic individuals while avoiding symptomatic hypoglycemia, I will be satisfied. I would appreciate those who want to purchase my book and derive some benefit from reading it to leave a positive review on Amazon so that others will see the book when they search for books on T1D. The search rankings in Amazon are based on the number of books purchased and the number and ratings of the reviews of the book.
Comments or general questions are welcomed.
Till next time….
Hank had several questions that I think others would be interested in hearing my answers. Note that all of his questions are answered in detail in my book, Master Type 1 Diabetes: The Simple, Low-Cost Method to Normalize Blood Sugars, but I will answer them in this post as well.
- “How often do you compare your estimated A1c to a lab value?” The last time I measured my HbA1c was in late 2015. As explained in post #23: The HbA1c Test – Does It Just Reflect Average Blood Glucose?https://ketogenicdiabeticathlete.wordpress.com/2016/04/23/23-the-hba1c-test-does-it-just-reflect-average-blood-glucose/ HbA1c is an approximate measure of mean blood glucose and is altered by multiple factors. As a measure of glycemic control, HbA1c also provides no information on glycemic variability which can be obtained from self-monitored blood glucose (SMBG) measurements or continuous glucose monitors (CGMs) by calculating the standard deviation and coefficient of variation.
- “Just curious have you ever considered a CGM?” Of course I have. CGM is a useful tool for monitoring glycemia especially for those who have difficulty achieving normal or near-normal mean blood glucose, difficulty achieving normal or near-normal blood glucose variability, difficulty with frequent hypoglycemia, especially symptomatic hypoglycemia. In my case, I’m not sure what benefit I could expect to gain from wearing a CGM. I can think of several downsides as well. First, I really wouldn’t want to wear a CGM until there were benefits to be obtained. Second, CGMs can be quite inaccurate in practice. Yes, published clinical trials show that they are very accurate, but that is not what I hear from actual users of CGMs. Thus, I would still have to measure my fingerstick blood glucose at least 4 times a day before administering insulin. Third, why have an ongoing cost of tool that has a low benefit to risk ratio? The risk being the temptation to treat a CGM result with insulin (for a high BG) or glucose (for a low BG) without first doing a SMBG. In addition, a recent study found that “The majority of participants (91.7%) were using CGM, with one-half (50.8%) incorporating automated insulin delivery (AID). Despite high use of diabetes technologies, only 57.7% reported achieving glycemic targets (hemoglobin A1c <7%). Severe hypoglycemic episodes (SHEs) and impaired awareness of hypoglycemia (IAH) still occurred, with ≈20% of respondents experiencing at least one SHE within the prior 12 months and 30.7% (95% CI 28.7, 32.7) reporting IAH, regardless of CGM or AID use.”
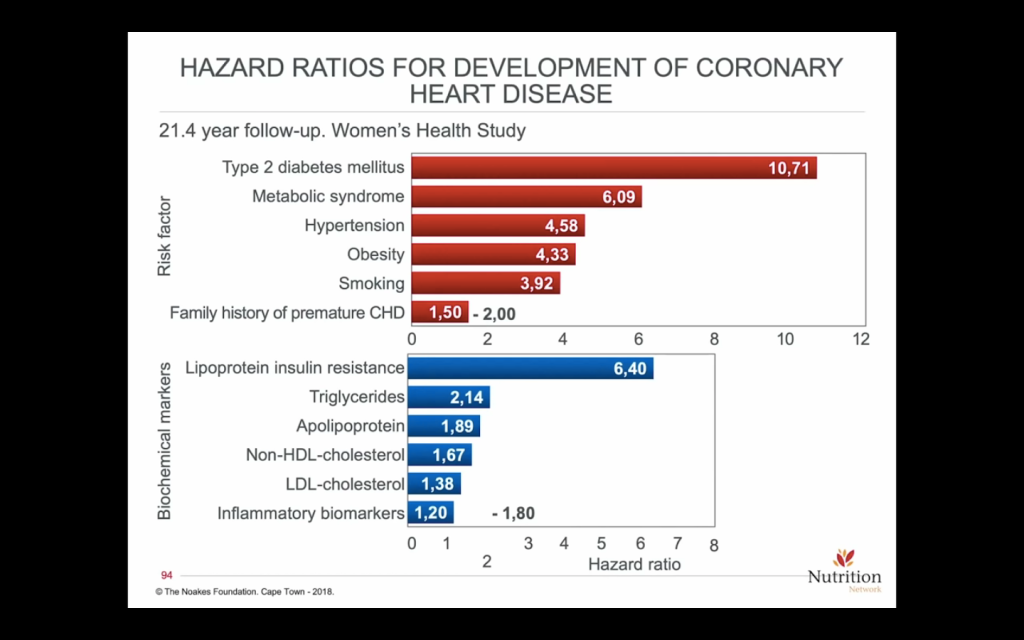
- “Also, I would be really interested if you maybe did a side/one off post on lipids. Like what do you measure, LDL-C or ApoB? Do you treat with a statin or other? How aggressively? Lipids are definitely relevant to the DM1 population and undertreated IMO. Thanks.” Measuring blood lipids can provide useful information. For example, elevated fasting serum triglycerides and/or low HDL-C are two of the five criteria for metabolic syndrome which is a state of dietary carbohydrate intolerance. Thus, dietary carbohydrate reduction to yield a fasting triglyceride level to <100 mg/dl and HDL-C to >40mg/dl for men and > 50 mg/dl for women by following a well-formulated low-carb/ketogenic diet would be a useful outcome from checking one’s lipid levels. If these are achieved using a low-carbohydrate diet, the LDL-C and total cholesterol may go down, stay the same, or go up. Some very lean (low % body fat or BMI), athletic, persons on a low-carb diet may experience a marked increase in LDL-C. This is referred to as a lean mass hyperresponder. Readers can search for Dave Feldman and Nick Norwitz, PhD in pubmed and YouTube and http://www.cholesterolcode.com for more information on this topic. Nick Norwitz made a 1 page handout for persons following a low-carb diet who may want to lower their LDL-C/apoB here. The American Diabetes Association, American Heart Association, as well as other organizations recommend all persons with diabetes take a statin whether or not they have heart disease to lower their risk of future cardiovascular events like heart attack or stroke. I think treating a risk factor (biomarker) rather than a disease (atherosclerosis) with a drug (statin, PCSK-9 inhibitor, etc.) for a lifetime requires shared decision making between a physician and his/her patient. In addition, LDL-C and apoB has a low hazard ratio for prediction of cardiovascular events compared to, for example, glycemic control and variability, hypertension, obesity, metabolic syndrome, double diabetes, etc., see the figure below. A review article emphasized that “The mean A1C is the most significant modifiable risk factor for first cardiovascular events, as well as subsequent cardiovascular events.” Thus, improving glycemic control should be emphasized above treating biomarkers (LDL-C or apoB) with drugs for primary prevention of CVD. Current medical guidelines recommend treating all persons with diabetes with a statin regardless of their glycemic control, LDL-C or apoB level, or coronary artery calcium score (CAC). This seems to be a shotgun approach that can’t possibly apply to every person with diabetes. This opinion article points out several important fallacies of widespread use of statin drugs in “all persons with diabetes” and concludes that “The statin diabetes conundrum may only be resolved by long-term RCTs but, until then, we must acknowledge that the evidence to support the use of statins in diabetes is inconsistent and the long-term risks of statins may have been under-appreciated.” That is why medical guidelines cannot be universally applied to all individuals and the patient’s values and risk tolerance must enter into medical decision making. For me, there is no data that I could use to help me decide for myself whether taking a statin would lower my risk of cardiovascular disease (CVD) since my glycemia is normal, my triglycerides last check were <70 mg/dl, my HDL-C was >90 mg/dl, my LDL-C was 136 mg/dl, apoB was 100 mg/dl and my CAC score was zero in 2018 at age 58 after having had diabetes since 1998 and being on a ketogenic diet since 2012. Thus, I do not take any cholesterol lowering drugs at this time. Hank I hope that answers your questions.