May 2017 was my first personal experience with taking the medication metformin. I developed two common side effects: diarrhea and fatigue. I did not follow my own advice of slowly increasing the dose over time which is likely responsible for these side effects. After quickly increasing the dose to 1000 mg twice daily and developing these side effects, I stopped it for a few days and restarted at 500 mg once daily at dinnertime. So far, so good. I will increase more slowly from this point forward. I think it is too early to understand whether or not it has a beneficial effect, so I did not attempt to make that assessment.
Glycemic Management Results for June 2017
June 2017 glycemic results were noteworthy for more hyperglycemia requiring increasing insulin doses during the month. Fortunately, I had quite a bit less hypoglycemia with no symptomatic hypoglycemia. Hypoglycemia in a person with T1DM who is conscientiously trying to control blood glucose (BG) is a real danger that should be minimized by slightly underestimating the insulin dose (e.g. by 0.5 IU) to be administered (in my opinion). Additional insulin correction doses can always be given later to correct hyperglycemia.
Below are my mean blood glucose (BG) values, mean insulin doses, and BG frequency distribution for June 2017 compared to previous time periods. I have changed two columns to indicate the AUC mean BG and predicted HbA1c. AUC mean BG is the mean BG by calculating the area under the curve (AUC) of BG versus time. The predicted HbA1c uses the formula: AUC mean BG plus 88.55 divided by 33.298. This formula is the least squares fit using my own personal mean BG versus measured HbA1c over many years. My particular HbA1c values are higher than most other individuals with the same mean BG. This is referred to as being a “high glycator.”
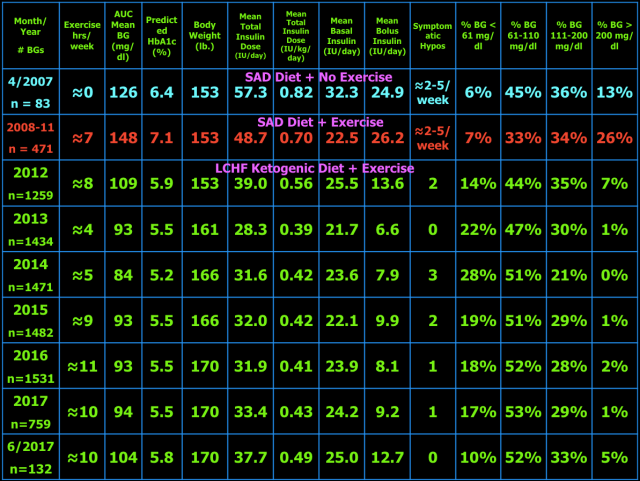
As presented in blog post #15 exogenous insulin cannot mimic normal insulin secretion, so persons with T1DM should not expect to have truly normal BG values. They just need to be low enough to prevent long-term complications and not so low as to cause unpleasant hypoglycemic symptoms, brain damage, seizure, injury, coma, or death. I have set my target BG range at 61-110 mg/dl because values in this range are not likely to lead to harm or complications of T1DM. Your target BG range should be determined with your physician because one size does not fit all. Normal BG is 96 ± 12 mg/dl (mean ± standard deviation (SD)) and coefficient of variation is 13% which is the weighted mean from these two studies (here and here) of continuous glucose monitoring in healthy subjects. The standard deviation and coefficient of variation are measures of BG variability which I believe are important in T1DM. However, be advised that clinical outcomes in type 1 diabetes (i.e. microvascular and macrovascular complications) have only been documented to correlate with measures of mean BG, particularly HbA1c. This does not mean BG variability is not important, but it just has not been documented to correlate with outcomes and complications of T1DM. Achieving a normal standard deviation or coefficient of variation in T1DM would be difficult, if not impossible, with current exogenous insulin therapy (injected or pumped). I hope that adding a continuous glucose monitor (CGM) to my therapeutic regimen will improve my BG variability and thus the standard deviation and coefficient of variation. I plan to get the FreeStyle Libre CGM as soon as it becomes available in the U.S. Monitoring the standard deviation and/or coefficient of variation and finding ways to improve them to the best of one’s ability is desirable in my opinion. Following a low carbohydrate ketogenic diet is one such method of reducing BG variability, mean BG, insulin doses, and hypoglycemia. A ketogenic diet may also provide an alternate/additional brain fuel in the form of ketones to protect the brain when BG does go low. The alternative energy that ketones supply to the brain may prevent or blunt the sympathoadrenal response to hypoglycemia which in turn reduces or eliminates the symptoms of and harm from hypoglycemia. This hypothesis needs to be tested before it can be stated as fact. Having BG close to normal most of the time (some of which are hypoglycemic) also minimizes the symptoms of mild hypoglycemia and potentially the harm from hypoglycemia as well due to lack of activation of the sympathetic nervous system and adrenal gland responses to hypoglycemia i.e. sympathoadrenal-induced fatal cardiac arrhythmia, see here.
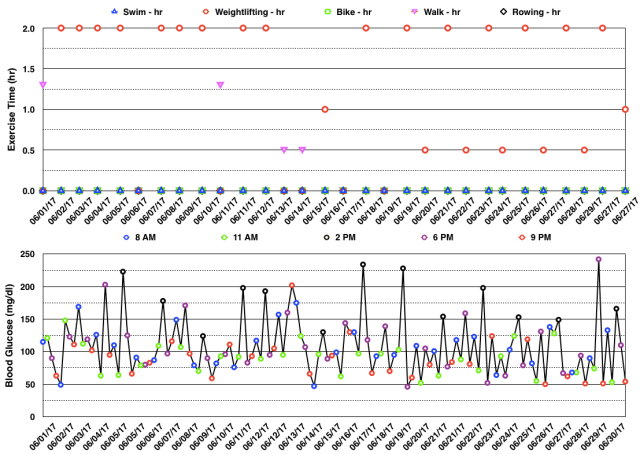
Below are my BG readings along with exercise type and time for June 2017. You can see below that most of the hyperglycemia occurred after weightlifting (at 2 pm – black circles or at 6 pm – magenta circles). I have explained in prior blog posts that this may be related to stress hormones which are normally released during intense exercise that serve to increase both BG and fatty acid levels in the blood to provide exercising muscles with additional energy. Because those with type 1 diabetes (T1DM) cannot make insulin, BG can rise with intense exercise and will need to be corrected with exogenous insulin. I don’t like the fact that my BG increases so much with weightlifting. However, it beats the alternative of hypoglycemia and loss of performance during the workout. I have not used exogenous insulin prior to a workout in anticipation of hyperglycemia for fear of hypoglycemia. Hopefully, any adverse effects from these temporary rises in BG will be mitigated by the benefits of the exercise itself.
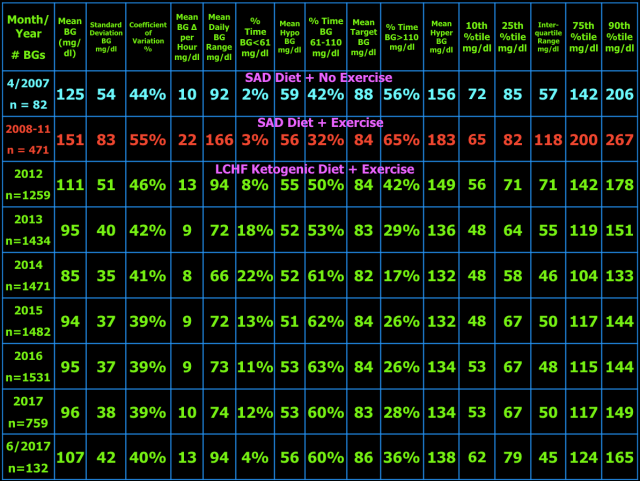
The table below shows the BG variability results for current and previous time periods. The percentiles (10th, 25th, 75th, 90th) on the right show the spread of the BG readings about the median. The interquartile range, the difference between the 75th and 25th percentiles, is a measure of BG variability. In the middle of the table are the %Time in three BG ranges: %Time BG < 61 mg/dl (hypo) and the mean BG during that time, then %Time BG 61-110 mg/dl (target) and the mean BG during that time, and %Time BG > 110 mg/dl (hyper) and the mean BG during that time. The other measures of BG variability were defined and explained in blog post #10.
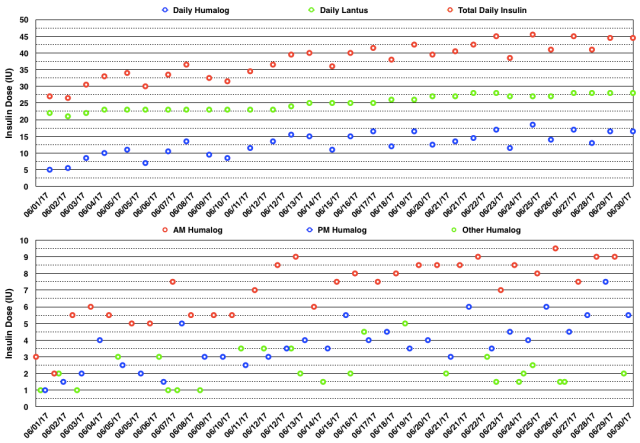
The actual daily insulin doses and daily insulin dose totals are shown in the graphs below. You can see that I had to increase my insulin doses progressively during the month from 27 IU/day to 45 IU/day. I have yet to understand why my doses vary so much over time other than the simple fact that exogenous insulin therapy does not mimic endogenous insulin secretion. Nor have I found a way to make the insulin doses more stable while still enjoying the exercise that I know contributes to glycemic variability. I had to take multiple extra rapid-acting insulin doses to correct hyperglycemia and I had to increase both basal and mealtime bolus insulin doses during the month.
I did not measure blood or breath ketones in June.
In July, I will continue olympic weightlifting every other day. I am taking a break from regular aerobic exercise and instead I am stretching and foam-rolling every other day as well as doing rotator cuff exercises to rehab my left shoulder which I injured in March 2017. The foam-rolling has been effective in resolving trigger points (along with two rounds of trigger point dry needling) in my IT bands which has resolved the IT band syndrome in my right knee.
My Thoughts About Management of Type 1 Diabetes With A Ketogenic Diet
My goal of glycemic management in T1DM with a ketogenic diet is to keep BG as close to normal i.e. 96 ± 12 mg/dl (mean ± SD) as is safely possible (i.e. avoiding hypoglycemia) to avoid diabetic complications, a reduction in lifespan, and unpleasant symptoms of as well as injury and death from hypoglycemia. For me, a well-formulated whole-food nutrient-dense ketogenic diet (see blog post #9 for more details), daily exercise, frequent BG measurements, and lower insulin-analog doses (Humalog/Lantus) have improved my glycemic control, hypoglycemic reactions, and quality of life. My current version of ketogenic diet has changed slightly since I last wrote about it in detail in blog post #9.
My current diet looks like this.
What I Cook & Eat
•Beef, grass-fed, including meat (85% lean), heart, liver, and kidney (liverwurst)
•Fish, mainly wild Alaskan salmon
•Canadian bacon (uncured pork loin)
•Lamb occasionally
•Chicken & Turkey occasionally
•Chicken Eggs
•Non-starchy vegetables (about 5% carbohydrate content by weight) including Cabbage (Red, Green, Napa), Kale, Collard Greens, Spinach, Bell Peppers, Raw Carrots, Leeks, Onions, Brussels sprouts, Home-made Sauerkraut from Red Cabbage, Bok-Choy, Broccoli, Cauliflower, Yellow Squash, Zucchini, Cucumber, Lettuce (Iceberg & Romaine), and some others.
•Fruit – Avocado, Tomatoes, Olives, Strawberries, Blueberries, Blackberries, lemon juice on fish and salads
•Nuts & Seeds – Pepitas, Macadamia, Brazil, Pecan, Walnut, Pistachio, Cashew.
•Note: I developed an intolerance to milk prior to my diagnosis of T1D. I did try heavy whipping cream after starting my KLCHF diet, but am also intolerant of it. I do tolerate butter, but wanted to decrease my fat intake, so eliminated all dairy including cheese and yogurt.
What I Drink
Water (filtered by reverse osmosis), Unsweetened Tea & Coffee
What I Don’t Eat
•Grains – Wheat, Corn, Rice, Oats (there are many more) or anything made from them, which is too numerous to list here. Gluten is a protein present in a number of grains (all varieties of wheat including spelt, kamut, and triticale as well as barley and rye.) which can cause a number of medical problems for a significant portion of the population with gluten sensitivity or celiac disease. In my case, I avoid them due to their carbohydrate content.
•Starchy vegetables – potatoes, sweet potatoes, yams, most root vegetables (turnip root okay), peas
•Legumes – peas, beans, lentils, peanuts, soybeans
•High sugar fruits – includes most fruits except berries, see above.
•Sugar and the fifty other names used to disguise sugar.
•Vegetable Oils (really seed oils) – Canola, Corn, Soybean, Peanut, Sunflower, Safflower, Cottonseed, Grape seed, Margarine & Butter substitutes, Shortening.
•All Processed Food-like Substances i.e., most of what is in the grocery store.
•I avoid restaurants except when traveling, and then order fish or steak with plain steamed non-starchy vegetables (no gravy or sauces that typically contain sugar, cornstarch, or flour) or salad.
•Refined, but healthy, Fats – I have eliminated refined fats from my diet including butter, coconut & olive oils.
What I Don’t Drink
•Colas (both sweetened, artificially sweetened, and unsweetened).
•Fruit Juice except small amounts of lemon juice.
•Alcohol (can cause hyperglycemia or hypoglycemia in persons with diabetes).
•No artificial sweeteners, don’t need or like them.
A large part of my fat intake comes from nuts & seeds which hypothetically could result in potential adverse consequences from omega-6 polyunsaturated fats in the opinion of some low carb advocates. However, I have yet to see any studies that show harm from eating nuts & seeds. As a reference, the average fat breakdown of the seven nuts & seeds that I eat daily is 33% polyunsaturated, 52% monounsaturated, and 15% saturated fat. However, when my entire diet is analyzed, 26% of my fat intake is from polyunsaturates, 56% is from monounsaturates, and 18% is from saturated fats. When my diet is broken down by macronutrients, I consume 170 grams of fat (or 68% of my total daily calories), 70 grams of carbohydrate, 30 grams of which is dietary fiber (or 12% of my total daily calories), and 110 grams of protein (or 20% of my total daily calories). In calories, it totals to 2,250 kcal/day.
My exercise regimen and its resulting varying insulin sensitivity and hormonal changes actually makes glycemic management more difficult i.e. challenging, but I enjoy exercise and feel it has other health and lifespan-extending benefits. Hopefully, my BG values and variability as well as my lower insulin doses that result from my ketogenic diet and exercise are close enough to optimal to avoid any reduction in lifespan, diabetic complications, and harm from hypoglycemia. Only time will tell.
Till next time ….

Your dose of basal insulin looks a little high. In Dr. Richard K Bernstein’s book he says that most T1’s do not need more than 8 units of long acting insulin per dose. Dr. Bernstein seems to recommend <=8 units in the morning and a divided dose of <=8 units at bedtime and ~4 hours later (eg., 4u then 4u four hours after falling asleep). Thus, the daily basal insulin would be 8+4+4=16 units total.
I discovered this information because I am trying to help a t1 athlete on a low carb diet. He has a lot of lows that I believe are related to taking too much Levimir (23 units in the morning and 18 at dinner, far more than you). I am working to greatly reduce his dose and to change the timing of his dinner shot to bedtime. (I would prefer he had access to Ultralente). It looks like you have very few symptomatic hypos so I am assuming you think your dose is optimal.
LikeLike
Thanks for your comment. Insulin doses, both basal and bolus, are determined by the glucose response that is as close to normal as is safely achievable i.e. minimal hypoglycemia. In other words, there is no one dose that would apply to everyone. Yes, you can say that a certain dose that might apply to most, but when you are looking at one person, you can’t apply a rule for the majority to that one person. An insulin dose reduction to a certain level is not the most important goal, it is the glucose response that is important. A lower insulin dose is a side effect of a low carbohydrate dose, albeit a good side effect. The lower rates of hypoglycemia is related to the lower insulin doses. Bottomline, your statement, “Your dose of basal insulin looks a little high,” doesn’t have much meaning. You should also be aware that when any comparisons of insulin doses are made between different persons, that the comparison is IU of insulin per kg body weight, not on the IU dose alone. Heavier people need more insulin.
LikeLike
You said that “A lower insulin dose is a side effect of a low carbohydrate dose”. My point is that Dr. Bernstein says long acting insulin should not cover meal carbs, so according to him at least a low carb diet should have no bearing on basal insulin dose. I am not sure if he thinks weight is an issue, according to what he wrote it seems like he doesn’t think it should be a factor unless I suppose a person is obese (most athletes aren’t).
He suggests a cumbersome means of fine tuning basal insulin, but I am interested in knowing how you fine tune it. Thanks.
LikeLike
The lower insulin dose I was referring to was total insulin dose which yes is a reduction in bolus insulin dose. If you look at any of my blog posts, you will see that my mean basal insulin dose as been constant at 0.32 IU/kg body weight since I started regular exercise in 2008. The dose does oscillate up and down, but the average remains rather constant through the years and did not change with the ketogenic diet which I started in 2012. Of course, Dr. Bernstein knows that body weight affects insulin dose. The method of adjusting basal insulin is to obtain a near-normal fasting BG level without nocturnal hypoglycemia. The exact way of doing that depends on which basal insulin is being used. You could read my book, The Ketogenic Diet for Type 1 Diabetes here which describes how to adjust basal insulin. Insulin doses in general are not fine tuned. They are constantly adjusted to ever changing conditions, i.e. there is no “set it” and “forget it.” Unfortunately, exogenous insulin injections are a poor substitute compared to what a normal pancreas does.
LikeLiked by 1 person