
In the previous post, I described the results of starting a ketogenic low carbohydrate high fat (KLCHF) diet to improve my BG control for T1D and how it helped me finish an ironman distance triathlon.
In this blog post, I continue with my story and the results obtained in 2013. In January of 2013, I decided to start measuring blood ketones to first see if I really was in nutritional ketosis and I was also curious to see if there was any correlation between blood ketone levels and lack of symptoms of hypoglycemia. I was pleased with my improvement in BG from 2012, but was inspired by Richard K. Bernstein, MD’s accomplishments to lower my mean BG and HbA1c further.
Ketone Metabolism – the quick and dirty
I will be doing a future blog post on ketone metabolism, but as way of a brief introduction, ketones are produced by your liver normally anytime your dietary intake of carbohydrates is restricted whether that be through dietary manipulation, fasting, or starvation and is referred to as ketogenesis. Your body (liver) makes them to supply vital organs (e.g., brain, heart, kidneys, muscle) with a steady supply of energy. Most tissues in your body can use fat in the form of free fatty acids as an energy source, however, the brain in particular does not have ready access to those free fatty acids (due to the blood brain barrier) so it really needs ketones under these circumstances (dietary carbohydrate restriction, fasting, or starvation). The liver and kidneys also make glucose from multiple sources (dietary and recycled protein/amino acids, glycerol from triglycerides, recycled lactate, and even acetone in small amounts) and is referred to as gluconeogenesis. Thus, our bodies are well equipped to deal with these circumstances (dietary carbohydrate restriction, fasting, or starvation). Thus, the brain has a constant source of both glucose and ketones courtesy of the liver and kidneys. Ketones are released in the bloodstream by the liver and can be measured using home meters (Precision Xtra by Abbott and Nova Max Plus by Nova Diabetes Care). Both meters measure the ketone called beta-hydroxybutyrate (BHB) in millimoles per liter or mM which stands for millimolar and the is abbreviation I like to use. I used the Precision Xtra for all of my measurements below. According to The Art and Science of Low Carbohydrate Living by Drs. Stephen Phinney and Jeff Volek, blood BHB levels generally fall in the range of 0.5 to 3 mM during nutritional ketosis. With that brief introduction to ketones, I’ll first present my blood ketone measurements.
Blood Ketone Results
The first ten measurements were random on my usual KLCHF diet. Then, on April 9, 2013, I started supplementing my diet with coconut oil to see if the medium chain triglycerides (MCT) representing 15% of the total fat contained in coconut oil which are readily converted to ketones would actually increase my blood BHB levels and secondarily whether that might afford some protection against the symptoms of hypoglycemia.
As way of disclosure, eating coconut oil if taken in large amounts can cause diarrhea or more accurately very loose stools. It is not pleasant. I had to slowly increase the amount starting with 1 tablespoon a day and eventually worked it up to 10 tablespoons a day (not recommended).
Initially, it seemed like the coconut oil was increasing the blood BHB levels, but as time passed it became apparent that it was not having a large effect. The mean blood BHB concentration prior to coconut oil was 2.0 mM and after the coconut oil was 2.7 mM, but more interesting was the wide fluctuations in blood ketone levels.

The bar chart below shows the distribution of blood BHB levels. Ninety-two percent of the measurements were in or above the range of nutritional ketosis confirming that I was able to follow the KLCHF diet quite consistently. Eight percent of the values were below the range of nutritional ketosis which is hard to explain since I have never deviated from the KLCHF diet, but it was not a major concern to me.

By September of 2013, I decided to focus primarily on measuring my blood BHB when my BG was low (<50 mg/dl) to see if that was why I was not having symptoms of hypoglycemia. Up to that point I had not had any symptoms of hypoglycemia the entire year despite the fact that I was having more frequent BG values <50 mg/dl as a result of attempting to safely lower my mean BG. As can be seen in the graph below, when my BG was <50 mg/dl the BHB concentration ranged from 0.2 to 6.9 mM and I had no symptoms of hypoglycemia. As mentioned in the previous post, lack of symptoms of hypoglycemia can be good IF AND ONLY IF it is due to the brain using ketones as an energy source along with glucose. BUT if there is an inadequate supply of ketones and the lack of symptoms of hypoglycemia is due to hypoglycemia unawareness (see previous post for more details), then this represents a potentially dangerous problem. And to top it off, there is no way to definitively distinguish these two situations.

I also measured blood ketones before and after exercise and could not detect any consistent patterns. It was clear by the end of 2013 when I got the idea of entering the ketone data into a spreadsheet that there was no correlation between blood glucose and blood ketones. In addition, by the end of 2013, I had gained 6 lbs. which appeared to be mostly fat around my waist which wasn’t terribly surprising since 10 tablespoons of coconut oil contains 1,300 kcal in addition to my normal diet of about 2,700 kcal/day. So given my inability to see any significant benefit from consuming the coconut oil, I decreased it to 3 tablespoons a day and continued measuring the blood ketones until August 2014 when I finally gave up. After decreasing the coconut oil from 10 to 3 tablespoons a day, there did appear to be some decrement in blood BHB levels. So coconut oil seems to have a small effect on blood BHB levels, but given the amount that needs to be consumed and its effects on my bowels, I concluded it was not worth it. By the end of 2014, I stopped consuming coconut daily and I still use it on occasion for cooking and also found it makes a great skin moisturizer. Perhaps pure MCT oil might have produced a better blood ketone response, but I knew MCT oil can have an even more dramatic effect on bowel function and I was getting pretty tired of that effect. I figured I gave the coconut oil a fair trial and was willing to let it go.
Summary of Data Through 2013

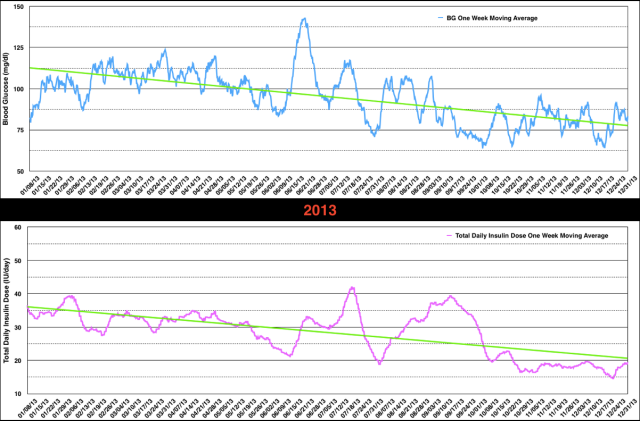
From the data above, when comparing 2013 with 2012 you can see that my mean BG improved from 107 to 95 mg/dl but the HbA1c was unchanged at 5.6%. My mean total insulin dose decreased from 40.1 IU/day in 2012 to 28.3 IU/day in 2013 as both the basal insulin (27.1 to 21.7 IU/day) and mealtime insulin (13.2 to 6.6 IU/day) decreased. I had no symptomatic hypoglycemic episodes in 2013, but the percentage of BG values <51 mg/dl doubled to 12% while the other BG ranges improved only slightly. Below are graphs of the one week moving average of both BG and total daily insulin dose which helps smooth out the data and observe the ups, downs, and trends.
I have to say 2013 was a baffling year for me. My KLCHF was unchanged, I was exercising less than in 2012 and had gained 6 lbs. body weight both of which if anything should have increased my insulin requirements. Instead, I was chasing low BG values by taking small doses of glucose tablets and decreasing insulin doses and even skipping some mealtime insulin doses. I was still interested in trying to achieve a normal mean BG (83 mg/dl) and this was reinforced by the lack of symptoms of hypoglycemia while operating under the assumption that my lack of symptoms was due to brain utilization of ketones (not necessarily a correct assumption).
In the next blog post, I’ll review my data from 2014 where I came close (85 mg/dl) to my target of 83 mg/dl but with a further increase in asymptomatic hypoglycemia. Although I am trying to present this in a chronological fashion, I didn’t actually start entering the BG and insulin dose data into spreadsheets until the later part of 2014.
I consider analyzing this data in a spreadsheet to be helpful in assessing the state of BG management and I wish had learned about spreadsheets sooner. This is in part why I am posting this information to hopefully encourage others with T1D to track their data as it provides valuable feedback.

Hi,
I am just wondering, what is “n” in the left column in the table.
Thanks, Svet
LikeLike
n is the number of blood glucose measurements taken during the indicated time period upon which the calculations are made.
LikeLiked by 1 person